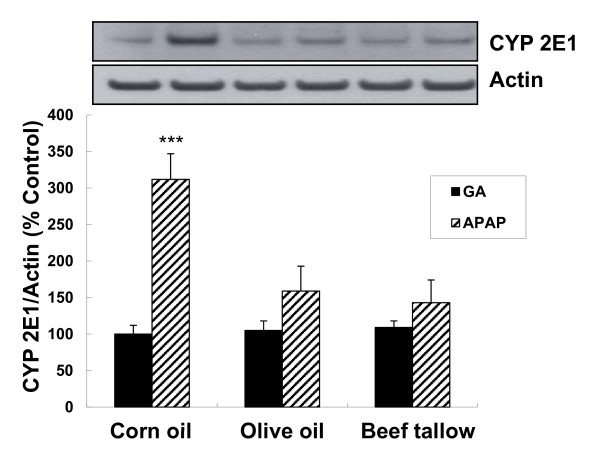
Figure 2.
Immunoblot analysis for cytochrome P-450 2E1 (CYP 2E1) in hepatic microsomes. Microsomal proteins were analyzed by Western blot with polyclonal antibody against CYP 2E1. All data were normalized to the actin content of the same sample. Each bar represents the mean ± SE (n = 6). *** p < 0.001 compared with gum arbic vehicle and APAP-treated groups by Wilcoson rank sum test.

