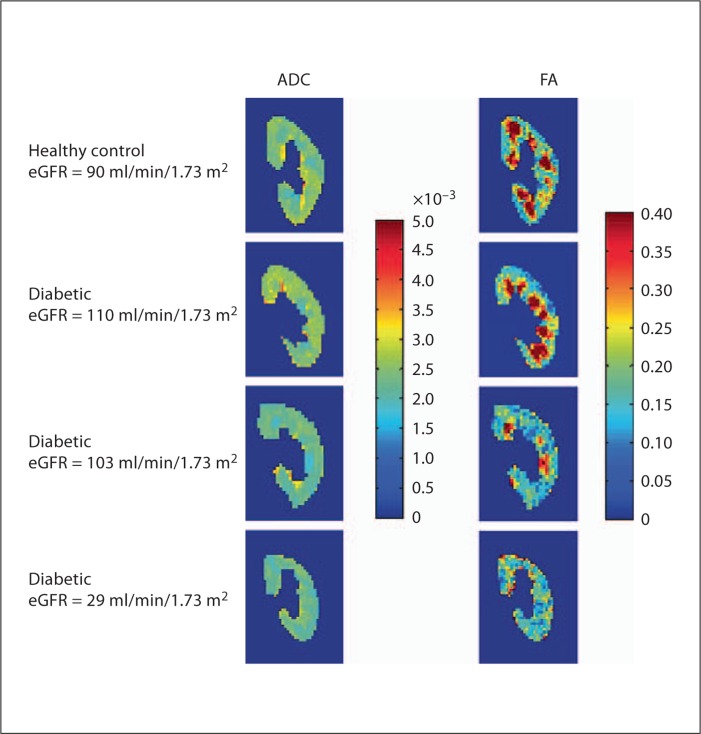
Fig. 2.
Comparisons of diffusion MRI parameters in a healthy control and in diabetics with different levels of estimated renal function. Imaging data (ADC and FA diffusion maps) are shown for a healthy control subject (first panel), 2 diabetic subjects with normal eGFRs (2nd and 3rd panel) and a diabetic subject with more advanced disease (4th panel). Medullary FA for 1 of the diabetic subjects with a normal eGFR is similar to that of the healthy control, with prominent areas of high FA evident. In contrast, medullary FA is decreased for the other diabetic with a normal eGFR as well as the diabetic subject with advanced CKD.

