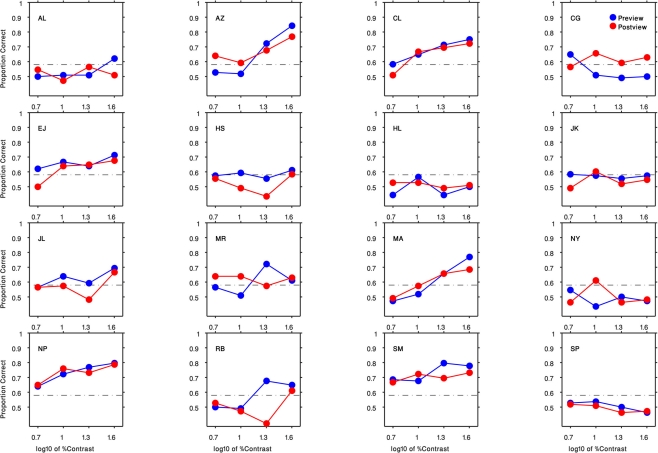
Figure 3.
Results of Experiment 1 for all 16 participants. Each panel indicates the result of an observer (initials indicated in the top left corner). The preview condition is shown in blue circles and the post-view condition is shown in red circles. Horizontal axis is the log10 of the gabor patch percent contrast (5, 10, 20, 40). Vertical axis plots the proportion of correct responses. The black dashed lines denote the level of performance significantly above-chance level (58% correct, based on the binomial distribution with 108 trials/condition).

