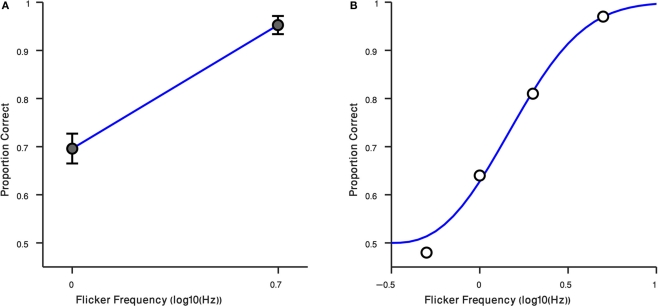
Figure 4.
Result of Experiment 4. (A) Performance of observers in two flicker frequency conditions (1 and 5 Hz). Error bars indicate ±1 SEM. (B) Result of Randolph Blake in four flicker frequency conditions (0.5, 1, 2, 5 Hz) are shown in black circles. The blue curve is a Weibull function fitted to data. Horizontal axis is the log10 of flicker frequency. Vertical axis plots the proportion of correct responses.

