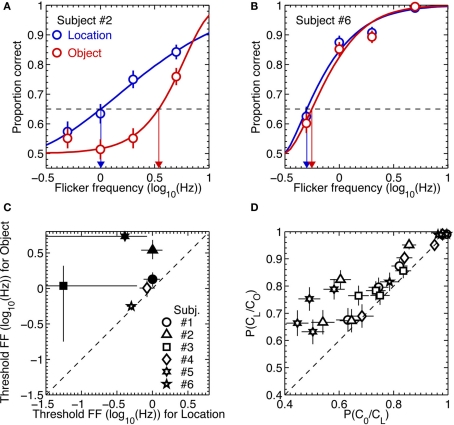
Figure 5.
Results of Experiment 3. (A,B) Example psychometric function fits to the data from two most extreme observers. The blue and red symbols are data from the location and object tasks, respectively. The thick lines are Weibull functions fitted to the data. The blue and red arrows indicate 65% (the broken horizontal lines) threshold flicker frequencies for the location and object tasks, respectively. The error bars are the standard errors of proportion correct, estimated from binomial distributions. (C) Threshold flicker frequencies from the location task are plotted against those from the object task. The different symbols represent different observers. The statistically significant differences in threshold between the two tasks are indicated by the solid symbols. The error bars are 95% confidence intervals, estimated from 2000 parametric bootstrap samples. (D) The conditional probability of being correct in the object task given correct location judgment are plotted against the conditional probability of being correct in the location task given correct object judgment for each of flicker frequency and for each subject. The different symbols represent different observers. The error bars are the standard errors of proportion correct, estimated from binomial distributions.

