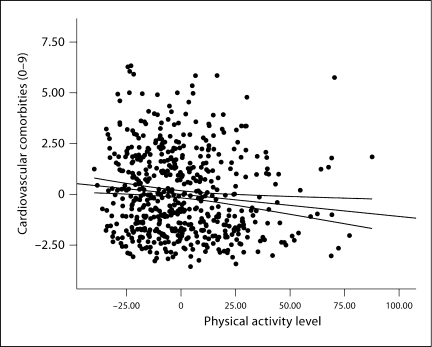
Fig. 3.
Partial regression plot along with lines of best fit and 95% confidence intervals for the association between self-reported physical activity and number of self-reported cardiovascular comorbidities adjusting for disability, MS clinical course, MS duration, sex, age, race, education, and income.

