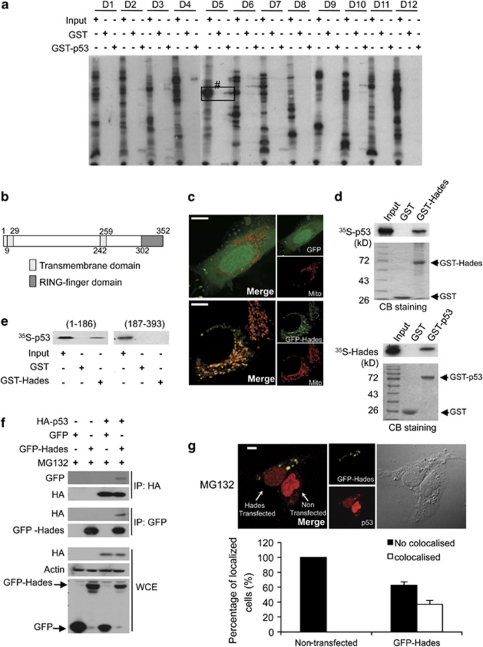
Figure 1.
Hades binds p53 in vitro and in vivo. (a) Screening for GST-p53 binding proteins among in vitro translated, 35S-labelled proteins derived from a cDNA library. Bound proteins were detected using autoradiography. The positive protein pool, no. D5, was progressively subdivided until a single positive cDNA clone (Hades) was isolated. Input was 10% of total protein in the binding reaction. (b) Hades contains one transmembrane (TM) domain at the N terminus, one TM domain in the central region, and one RING-finger domain at the C terminus. (c) Confocal microscopic images showing Hades localization in the mitochondria of U2OS cells, which were cotransfected with mitotracker and control GFP (upper panel) or GFP-Hades (lower panel) plasmid. The scale bar represents 10 μm. (d) In vitro pull-down assay shows that Hades interacts with p53. In vitro translated, 35S-labelled p53 interacted with GST-Hades (left panel). In vitro translated, 35S-labelled Hades interacted with GST-p53 (right panel). (e) The N-terminal region of p53 interacts with Hades. An in vitro translated, 35S-labelled N-terminal (aa 1–186) or C-terminal (aa 187–393) fragment of p53 was incubated with GST-Hades, and bound proteins were detected by autoradiography. (f) Hades interacts with p53 in vivo. p53 null H1299 cells were cotransfected with HA-p53 and GFP-Hades expression plasmids. At 24 h after transfection, anti-GFP or anti-HA immunoprecipitates were subjected to immunoblotting using anti-HA or anti-GFP antibody. (g) Hades is colocalized with p53. U2OS cells were transfected with GFP-Hades expression plasmids and, 24 h later, incubated in the presence (lower panel) of MG132 (10 μM) for 4 h. Cells were then fixed, successively probed with p53 antibody and Texas Red-conjugated secondary antibody, and visualized by confocal microscopy. The scale bar represents 10 μm. Statistical results are the average of three independent experiments with 600 cells scored (bottom panel). Error bars represent the means (S.E.M.) of at least three independent experiments

