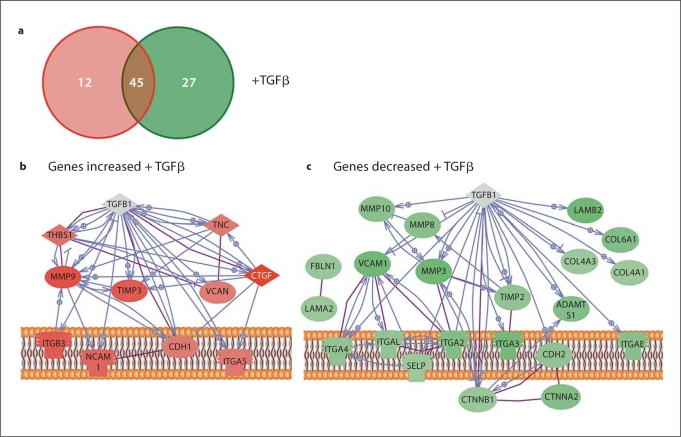
Fig. 5.
Immortalized mPSC altered ECM genes in response to TGFβ. The imPSCs were conditioned with low serum, stimulated with the growth factor TGFβ for 6 h, and the transcript levels of ECM and adhesion genes measured by real-time PCR arrays (SABioscience). a Summary of the number of genes changing was represented by red (transcript increased) and green circles (transcript decreased), with no change indicated in the overlapping region. Pathway diagrams were constructed from the genes increased (b) or decreased (c) following TGFβ treatment of imPSC. In the diagram, direct physical interactions are indicated with purple lines and expression regulation in blue. Genes with no interactions, therefore not diagramed, included: ADAMTS8, EMILIN1, ECM1, SYT1, NCAM2, ADAMTS5, THBS3, and CNTN1.

