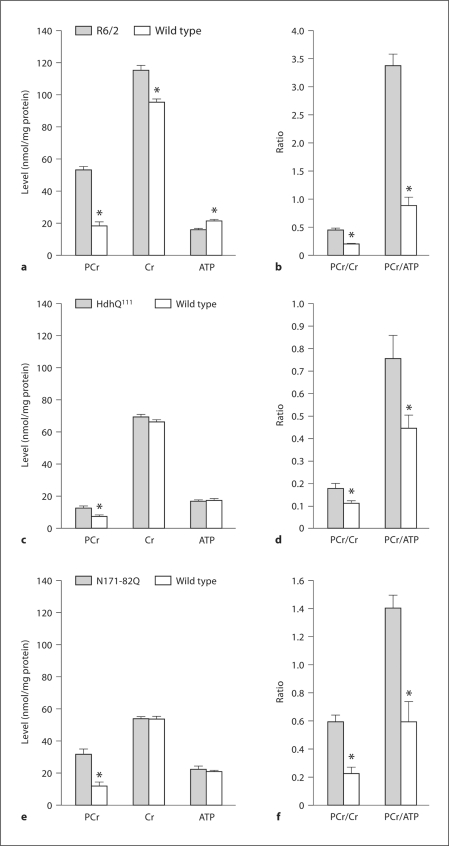
Fig. 1.
PCr, CR and ATP levels in brains of HD mice. Asterisk: significant difference between HD and wild-type values; p < 0.001 (R6/2), p < 0.05 (HdhQ111) and p < 0.03 (N171-82Q). Number of experiments: n = 14 for R6/2 and their wild-type littermates; n = 10 for HdhQ111 and n = 6 for their wild-type littermates; n = 10 for N171-82Q and their wild-type littermates. a, c, e PCr, Cr and ATP levels in the brains of R6/2, HdhQ111 and N171-82Q mice, respectively. b, d, f PCr/Cr and PCr/ATP ratios in the brains of R6/2, HdhQ111 and N171-82Q mice, respectively.

