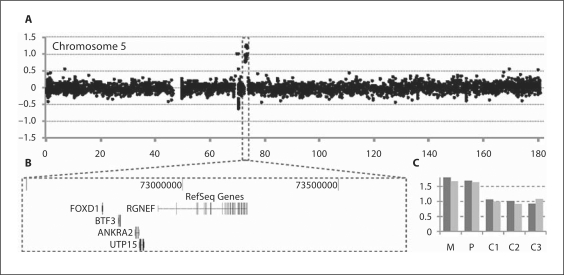
Fig. 2.
Submicroscopic duplication detected by array CGH. A The partial array CGH result for chromosome 5 is displayed. The black dots represent the individual targets from the array, ranged according to their genomic position on the X axis and their log2 ratio on the Y axis. The duplicated probes are highlighted by a box. B A screenshot from Ensembl genome browser demonstrates the duplicated region. C qPCR confirmation of the array results with 2 primer pairs. Relative copy numbers as estimated by the ΔΔCt method are displayed for the patient (P), the mother (M) and 3 normal control individuals (C1, C2 and C3). Values around 1 and 1.5 correspond to a normal copy number and a heterozygous duplication, respectively.

