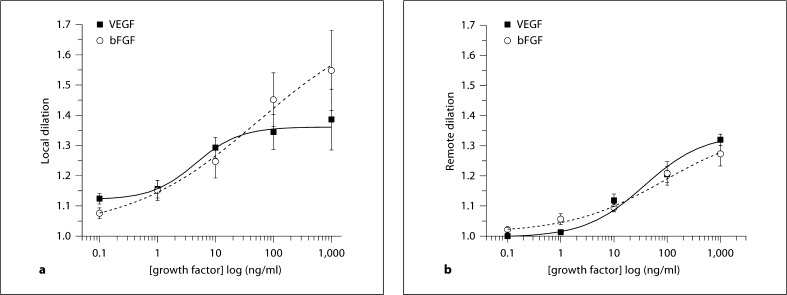
Fig. 2.
Shown is the normalized change in diameter [1 + (peak – baseline)/baseline] for the local (a) and remote (b) responses to growth factors. The x-axis shows the concentration in the micropipette. a Local response relationships for VEGF (n = 9) and for FGF2 (n = 7), using protocol 1. b Remote dilation response relationships for VEGF (n = 9) and FGF2 (n = 10), using protocol 2. The fitted EC50 and maximal values are in table 2. Data are presented as means ± SEM.

