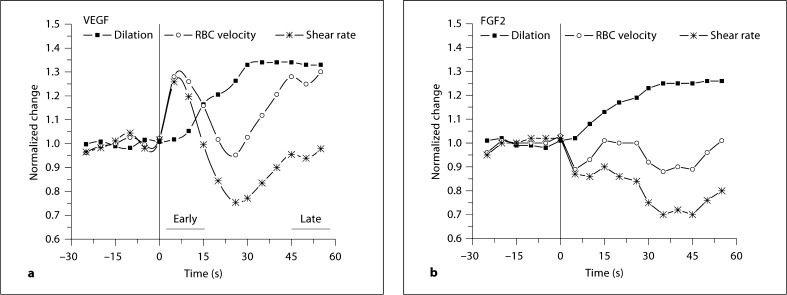
Fig. 3.
Shown are the normalized remote velocity, diameter and shear rate values [1 + (peak – baseline)/baseline] as a function of time with downstream VEGF (a, n = 11) or FGF2 (b, n = 7) at 1,000 ng/ml in the micropipette. Data was binned for each 5 s; error bars intentionally left off to observe trends. A 30-second baseline preceded a 60-second remote exposure; exposure onset is at 0 s on this graph.

