Fig. 2.
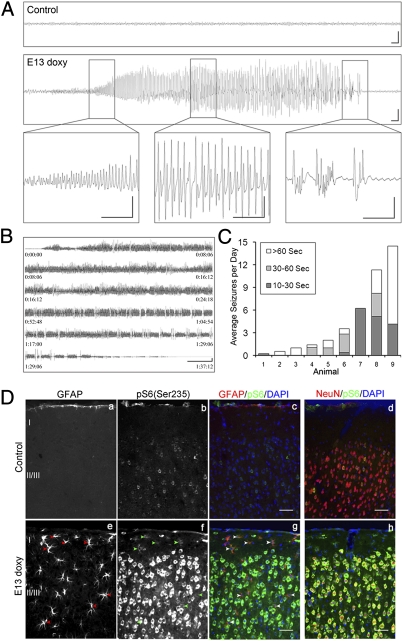
Spontaneous seizures with neuronal and glial mTORC1 activation in Tsc1cc Nes-rtTA+ TetOp-cre+ (E13 doxy) mice. (A) Cortical epidural EEG monitoring of P30 control mice (Upper) and Tsc1cc Nes-rtTA+ TetOp-cre+ (E13 doxy) mice (Lower), the latter during a seizure. (Insets) Onset of seizure activity (Left), progression to a period of sharp wave trains (Center), and then reduction with a period of postictal slowing (Right). (Scale bars: 1 s, 500 μV.) (B) Series of near-constant epileptiform discharges recorded in a mutant, leading to the death of this mouse. (Scale bar: 30 s, 500 μV.) (C) Average number of seizures per day in nine mutant mice. Shading indicates the duration of the observed seizures in untreated (columns 3, 5, 6, and 9) and vehicle-treated (columns 1, 2, 4, 7, and 8) mutants. (D) Immunofluorescence analysis of cortical sections of P55 mutant mice shows an increase in pS6(Ser235) (b–d and f–h) in both neurons (d and h) and astrocytes (a, c, e, and g, arrowheads). (Scale bars: 50 μm.)

