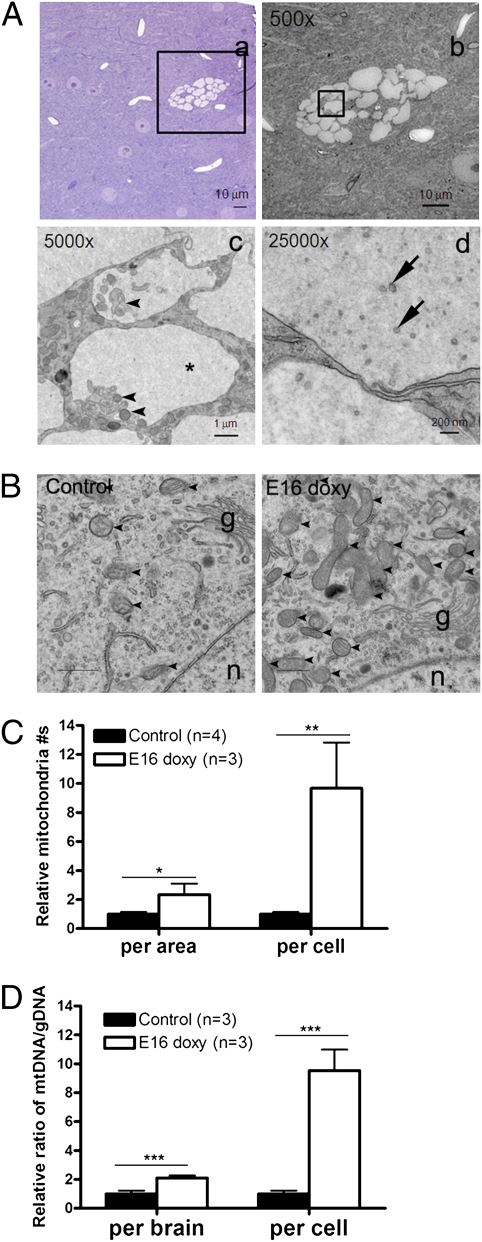
Fig. 6.
Ultrastructural analysis of giant cells in Tsc1cc Nes-rtTA+ TetOp-cre+ (E16 doxy) mice. (A) Highly vacuolated neurons seen in bright field (a) and electron (b–d) micrographs. Insets in a and b identify the area enlarged in the next panel. Single-walled vacuoles filled with protein-like material (asterisk), portion of ER membranes and endosomal membranes (arrowheads), and small vesicles (arrows) are shown. (B) Increased mitochondria in giant cells with small vacuoles in Tsc1cc Nes-rtTA+ TetOp-cre+ (E16 doxy) giant cells. Mitochondria (arrowheads), the Golgi apparatus (g), and the nucleus (n) are shown. (C) Relative mitochondrial density (per area) and contents (per cell) are increased in giant cells in mutants, calculated by considering the 4.1-fold increase in mutant cell volume. (D) Quantitative analysis of brain mtDNA content in Tsc1cc Nes-rtTA+ TetOp-cre+ (E16 doxy) mice by real-time PCR, using four mtDNA primer sets in comparison to gDNA primer sets. The relative mtDNA content per Tsc1-null cell was calculated considering the 13% level of recombination in Tsc1 seen in these same samples by MLPA. *P < 0.05; **P < 0.01; ***P < 0.001. Scale bars are indicated in A, a–d.

