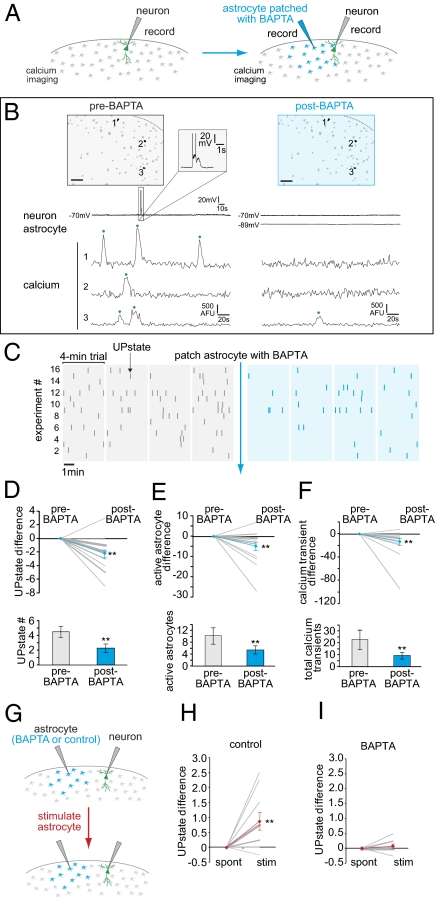
Fig. 4.
BAPTA injections into astrocytes inhibit spontaneous and stimulated UP states. (A) Schematic of BAPTA experiment. Four 4-min trials are carried out with a patched neuron. Next, a nearby astrocyte is patched with a BAPTA-filled pipette, and four more trials are recorded. The astrocyte is not depolarized. (B) One representative trial from each of the two conditions pre-BAPTA and post-BAPTA. An astrocyte calcium map shows the same three cells (all active pre-BAPTA) in both trials. Corresponding electrophysiology and calcium imaging from the two trials, with calcium transients marked by a green dot. (C) UP states (ticks) from 16 experiments under pre-BAPTA (gray) and post-BAPTA (blue) conditions. (D–F) Upper graphs show differences between conditions. Pre-BAPTA levels are set at zero, and data from each condition are summed across all four trials. Average difference values are displayed as blue lines. Bar graphs display average raw numbers for UP states (D), active astrocytes (E), and calcium transients (F) (n = 16 slices). (G) Schematic of stimulation experiment in BAPTA. After the last trial, the patched astrocyte is stimulated. The same protocol is followed in the control experiment (Fig. S3), with no BAPTA in the astrocyte pipette. (H and I) UP state difference upon stimulation without (H) and with (I) BAPTA in the astrocyte syncytium. (Scale bars, 50 μm.) **P < 0.01, paired two-tailed t test.

