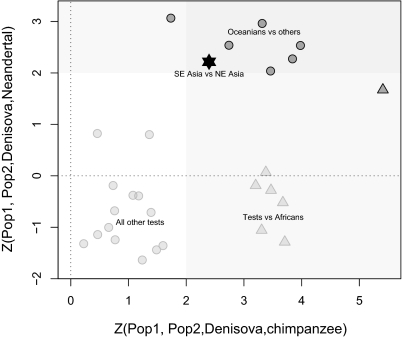
Fig. 3.
Results of 4-population tests suggest Denisova-related ancestry in Southeast (SE) Asia. Z scores for the D statistic in all pairwise comparisons between Africa, Middle East, Central/South Asia, Southeast Asia, Northeast (NE) Asia, Oceania, and America are displayed. The configuration of each pairwise comparison that gives a positive value of D in the test (Pop1, Pop2, Denisova, chimpanzee) was chosen to ease visualization. Except for Oceanians and the comparison between SE Asia and NE Asia, populations that show high affinity to Denisova compared with chimpanzee tend to also show a higher affinity to Neandertal compared with Denisova (negative values on the y axis). Comparisons with Africans are shown by triangles. The area corresponding to significant deviations from 0 (|Z| > 2) is shaded, with the overlap representing significant deviations for both tests (Table S4).

