Fig. 3.
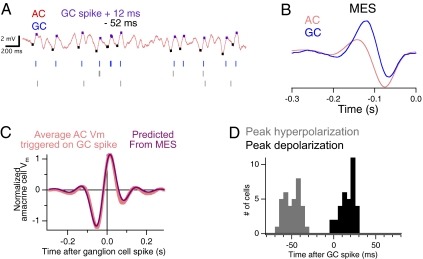
Linear amacrine cells hyperpolarize just before ganglion cells fire. (A) Simultaneous intracellular recording of an amacrine cell (Upper) and spiking response of three ganglion cells responding to uniform field white noise flicker (Lower). Stimulus duration was 300 s. Ganglion cells were separately measured to be inhibited by the amacrine cell. Tick marks on the amacrine cell response indicate times before and after each ganglion cell spike that correspond to the hyperpolarizing (−52 ms) and depolarizing (+12 ms) peaks of the correlation shown in C. (B) Mean effective visual stimulus (MES) for the amacrine and ganglion cell, computed as the spike-triggered-average of the visual stimulus, or the reverse correlation between the amacrine cell membrane potential and the visual stimulus. (C) Cross-correlation function between the amacrine cell and a ganglion cell, measured as the average amacrine cell membrane potential triggered on a ganglion cell spike, compared with the cross-correlation between the MES of the two cells. The cross-correlations were normalized by the SD of the amacrine cell response. (D) Peak time of hyperpolarizations and depolarizations relative to a ganglion cell spike measured from the cross-correlation function for seven amacrine cells and 35 ganglion cells.

