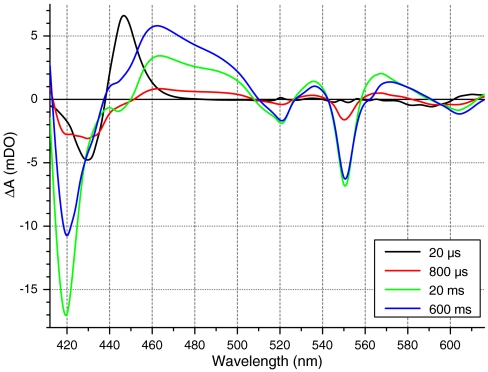
Fig. 2.
Monitoring by visible spectrophotometry the photoactivated reactions of the respiratory chain with oxygen. Spectra of whole yeast (W303) cells at various times after CO photolysis, under an atmosphere of PCO = 0.94 and PO2 = 0.06. The excitation light was switched from 605 to 430 nm in order to explore the red part of the spectrum (see Materials and Methods). Notable spectrophotometric signals include: CO photolysis from CcOx (see Fig. 1A), oxidation of CcOx (troughs at 445 nm and 605 nm), oxidation of cytochrome c (troughs at 420 nm, 520 nm, and 550 nm), oxidation of flavoproteins (band in the 440–500 nm region), and oxidation of b-type hemes (slight troughs at 430 nm and 560 nm, seen at longer times).

