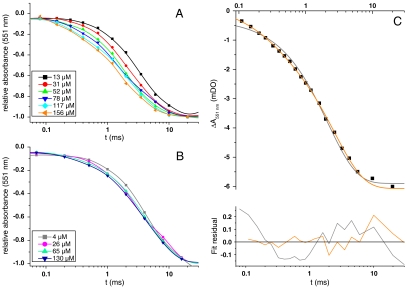
Fig. 4.
Kinetics of cytochrome c oxidation at different [O2], monitored at 551 nm. (A) W303 strain. (B) BY strain. (C) kinetics for [O2] = 156 μM of cytochrome c oxidation in the W303 strain, with monoexponential (gray line) and biexponential fits (orange line) of the data; the corresponding residuals are shown below.

