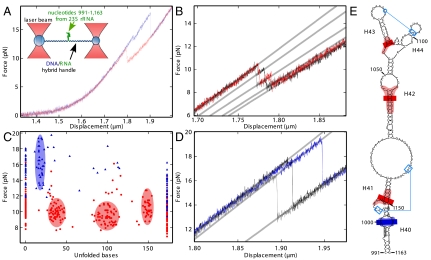
Fig. 1.
Stretching of the 991–1,163 rRNA fragment. (A) Force versus displacement (50 nm/s) curve for the rRNA fragment without (red) and with (blue) added L20C. The drops correspond to unfolding of the RNA structure. (Inset) Principle of the assay. (B) Three successive measurements (in red, black, and gray) on the same RNA molecule without L20C show reproducible intermediate states. (C) Distribution of the maximum force reached in a given state except for the fully unfolded state (173 bases) where the minimum force is given. The number of unfolded bases is deduced from the successive increase in length during the different substeps (SI Methods). This graph summarizes 38 and 87 individual measurements with (blue triangles) or without (red dots) L20C, respectively. (D) Same as B, except that L20C was present. The three successive measurements are in blue, black, and gray. (E) Positions of the intermediate states on the rRNA structure. Blue lines indicate tertiary interactions. Bars indicate the mean positions of unfolding intermediates and the colored regions represent the standard deviations around this mean. Intermediates with and without L20C are shown in blue and red, respectively. Nucleotides that contact L20 in the ribosome are in gray (2, 3).

