Fig. 5.
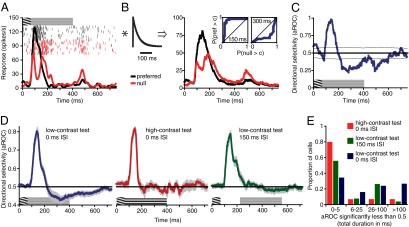
Responses of area MT neurons to stationary stimuli following brief exposure to motion. (A) Responses of an example neuron to 67 ms of grating motion in the preferred (black) or null (red) directions, followed by a low-contrast stationary test stimulus. Neural activity is shown as raster plots and firing rates as a function of time (obtained by convolving raw spikes with a Gaussian filter of σ = 10 ms). Inset near the top of the y axis shows the space–time plot of the stimulus time course. (B) Exponential filter (τ = 50 ms) used to implement the leaky integrator model and the result of its convolution with the example activity shown in A. Insets: ROC curves at 150 and 300 ms after motion onset. A complete sequence of time-dependent ROC changes for this neuron can be seen in Movie S1. (C) Direction selectivity of the example neuron in response to a stationary test stimulus. Direction selectivity is expressed as the aROC computed by using a 1-ms sliding window from responses shown in B. Thin lines show ±1 SD computed from a resampling analysis (Materials and Methods). Graphic over x axis shows the stimulus time course. (D) Population averages showing changes in direction selectivity for different stationary test stimuli. Graphics just above the x axes illustrate time courses of three conditions differing in the onset timing (0 vs. 150 ms ISI) and contrast (low vs. high) of the test stimulus. All error bars indicate SEM. (E) Histogram shows total duration of significant null-direction selectivity for three conditions differing in the onset timing (0 vs. 150 ms ISI) and contrast (low vs. high) of the test stimulus. The means of two low-contrast conditions were significantly higher than expected by chance alone (P < 0.001 and P = 0.016; Results and Materials and Methods provide further details).

