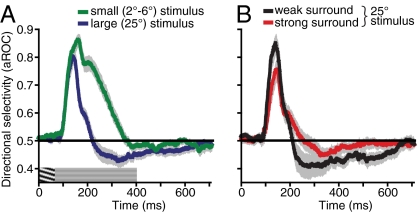
Fig. 6.
Effects of stimulus size and surround suppression on responses of MT neurons to stationary stimuli following brief exposure to motion. (A) Population average showing changes in direction selectivity over time for small and large stimuli (data for large stimuli replotted from Fig. 5D). Small adapting stimuli were matched to the size of the classical receptive field of each neuron (average radius, 3.7°). Direction selectivity was computed as described in Materials and Methods and Fig. 5. Graphic over x axis shows stimulus time course. (B) Population average shows changes in direction selectivity over time for neurons exhibiting weak or strong surround suppression. A median split was used to divide neurons into two groups (median SI, 0.41). All error bars indicate SEM.

