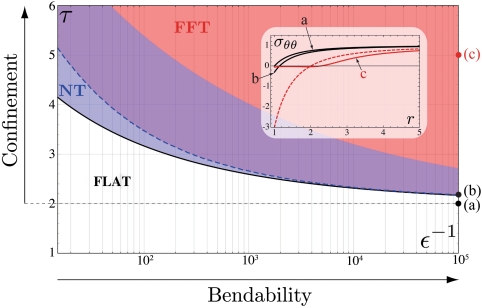
Fig. 2.
A schematic phase diagram of wrinkling patterns in the Lamé geometry. The dimensionless parameters ϵ-1, τ represent, respectively, bendability and confinement (see Eq. 8). Radial wrinkles emerge for ϵ, τ > τc(ϵ), where the threshold curve τc(ϵ), computed similarly to ref. 15, is marked with a black solid line. The NT analysis is valid below the blue dashed line (see text). After a cross-over region (purple), the sheet is under FFT conditions (red). The evolution of the hoop stress as τ increases is shown in the inset for ϵ-1 = 105 using three curves corresponding to points in the (ϵ,τ) phase space indicated in the main figure. Curves a and b show the stress profile as predicted by Eq. 6. However, curve c, which is well within the FFT region, shows that the hoop stress has collapsed in a manner compatible with Eq. 17. To emphasize the collapse of compressive stress, the red dashed line in the inset shows the hoop stress given by Eq. 6 for the same value of τ.

