Figure 5.
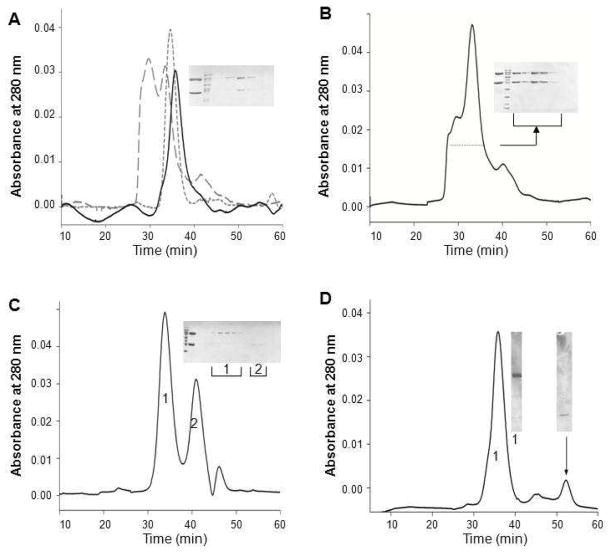
SEC analysis of detergent effects on reducing PG aggregation. A. Elution profiles of three forms of PDE6 in the absence of detergent. PDE6 (short dashed line) and PDE6/δ (solid line) eluted as single peaks, whereas PG (large dashed line) eluted as two major peaks indicating a mixture of a high molecular mass aggregate and a monomer. Insert: SDS–PAGE analysis of SEC fractions from the two PG peaks. The top band is PDE6 and lower band is GST–δ. Some detergents, such as Anapoe–35 (B), reduced aggregation of PG. Insert: SDS–PAGE analysis of SEC fractions (indicated with dotted line). In the presence of C8E4 (C), PG aggregation was almost completely abolished. PDE6 was found mainly in Peak 1 (insert, labeled as 1). The second major peak eluting after the PDE6 peak represented GST– PrBP/δ as indicated by SDS–PAGE analysis (insert, labeled as 2). D. SEC analysis of the PDE6/δ conformation in the presence of C8E4; 0.5 ml fractions were collected SDS–PAGE of fractions from the two major peaks is shown in the insert. The left band (labeled with 1) shows the fraction from the main peak with an estimated MW of 200 kDa whereas the right band illustrates the fraction from the last peak with an estimated MW of 15 kDa (as indicated with an arrow). For all inserts, analysis of the protein sample before SEC is shown next to the protein marker. The top band corresponded to PDE6 and lower band to GST–δ.

