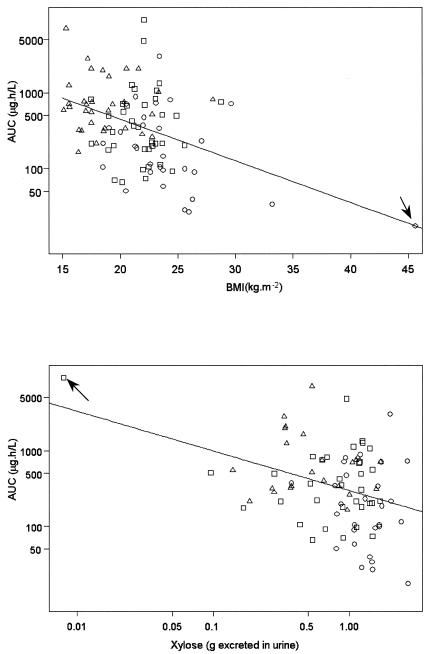
FIG. 3.
Correlations between AUC and BMI and log(xylose) for patients from group 1 (○), patients from group 2 (□), and patients from group 3 (▵). Arrows indicate outliers. The correlations remain statistically significant for BMI (r = −0.35 and P = 0.0004) and log(xylose) (r = −0.24 and P = 0.0271) when the outliers are removed from the analysis.

