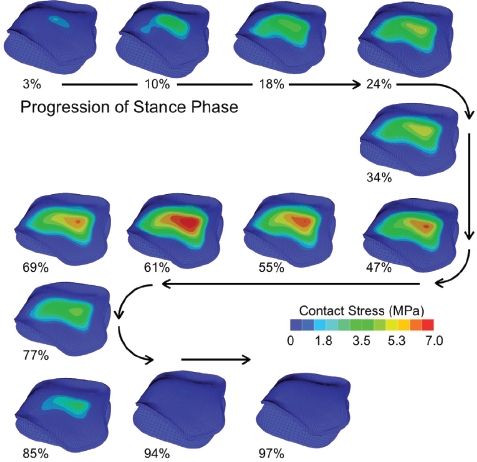
Figure 10.

An antero-superior (subchondral) view showing the contact stress distributions computed for the 13 instants of the stance phase of gait for an intact ankle. [Reprinted with permission from Li W et al. Patient-specific finite element analysis of chronic contact stress exposure after intra articular fracture of the tibial plafond. J Orthop Res. 26:1039-45, 2008.61]
