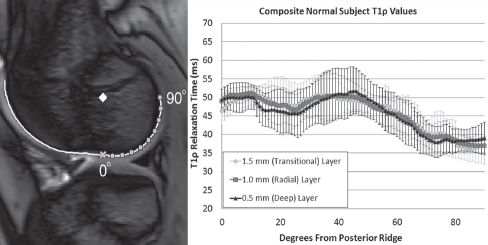
Figure 4.
Normal zone-dependent T1ρ relaxation values (±1 standard deviation). The inset image shows the Normal Subject 4's bone-cartilage interface line, the anthropometric central reference point (diamond), and the posterior ridge (x). The squares indicate 10° increments along the bone-cartilage interface.

