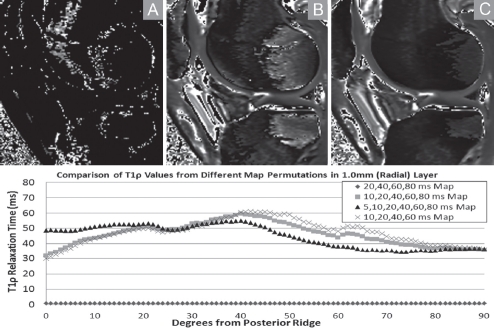
Figure 6.
The effects of using different subsets of spin-lock times to calculate T1α relaxation times are demonstrated by comparing the translational cartilage zone evaluations for normal knee 4. Panel A used 20, 40, 60 and 80ms (diamond) values reported by Li et al.1 Panel A times are most analogous to the AKA knee contours in Figure 6. Panel B shows the effect of adding the 10 ms spin-lock time to the T1α calculations (squares). The full set of six time points collected for the 2-D T1ρ evaluations in this study (Panel C) are denoted by the triangles.

