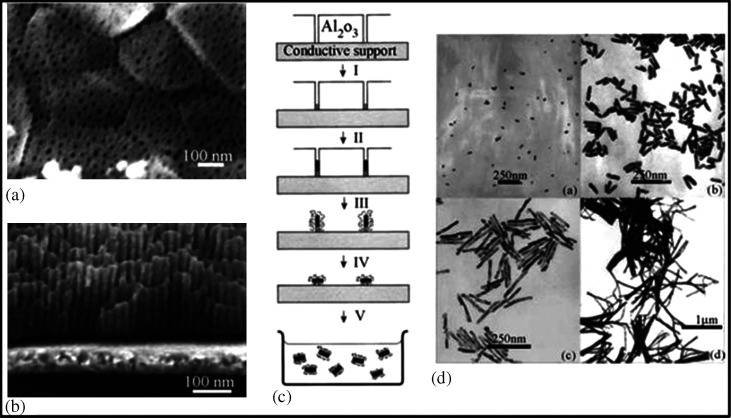
Fig. 24.
(A and B) FESEM images of an alumina membrane. (C) Schematic representation of the successive stages during formation of GNRs via the template method. (D) TEM micrographs of GNRs obtained by the template method. Reproduced with permission from Reference (234). American Chemical Society, Copyright (2000).

