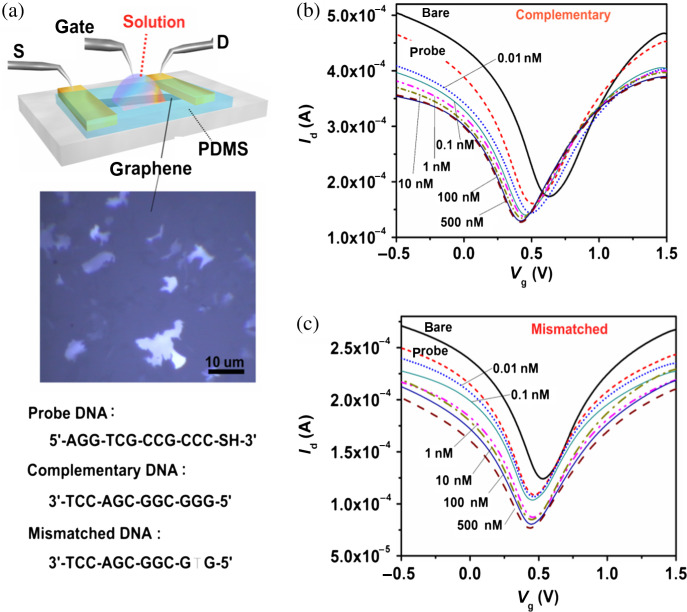
Fig. 6.
(a) Schematic illustration of the graphene device operated by liquid gating. The middle is an optical microscopy image of the graphene films. The bottom shows the DNA sequences used in the experiments. (b, c) Transfer characteristics for the graphene transistors before adding DNA, after immobilization with probe DNA, and after reaction with (b) complementary or (c) one-base mismatched DNA molecules with the concentration ranging from 0.01 to 500 nM. (Reproduced with permission from Ref 82, copyright 2010 Wiley-VCH).

