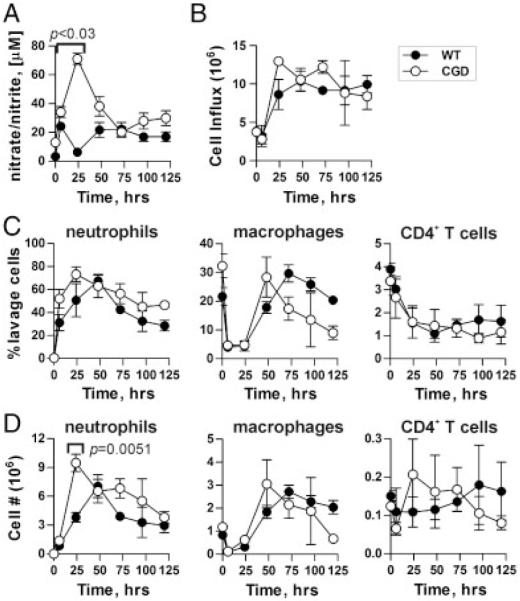
Figure 2.
CGD animals have increased NO but similar cellular influx in response to GlyAg challenge. (A) WT and CGD mice were challenged with GlyAg and SCC; then, peritoneal lavage with PBS was performed at the indicated time points (n = 3 independent animals per time point, per genotype on all Fig. 2 data). The resulting supernatants were tested for nitrates and nitrites using the Griess assay as a measure of NO production. (B–D) WT and CGD mice were challenged with GlyAg and SCC; then, peritoneal lavage with PBS was performed at the indicated time points and the cellular influx was characterized using flow cytometry and antibodies specific for neutrophils (α-GR-1), macrophages (α-F4/80), and CD4+ T cells (α-CD4). (B) The total responding cellular influx, (C) percent of each cell type, and (D) relative number (% multiplied by total cell count) of each cell type at the various time points are shown to compare WT and CGD animal responses. All data points represent n = 3 mice, all error bars represent mean±SEM, and comparisons were performed using an unpaired Student’s t-test with a two-tailed p value. All data points are not significantly different (p>0.05), unless indicated.

