
Figure 3.
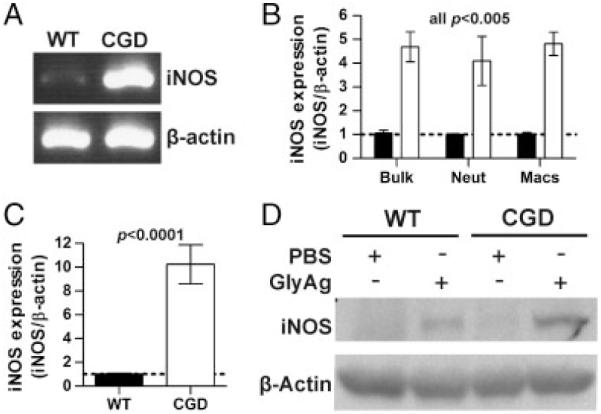
iNOS is induced to a greater extent in CGD cells compared with WT cells. (A) WT and CGD animals were challenged with GlyAg and SCC for 24 h. After peritoneal lavage, mRNA was isolated from the harvested cells and subjected to PCR using primers specific for iNOS gene transcript, using β-actin as a housekeeping control. The resulting PCR products were run on an agarose gel and the data shown are representative of n = 4 experiments. (B) Using quantitative PCR, we examined the upregulation of iNOS transcript in RNA isolated from bulk lavage cells (Bulk) or purified neutrophils (Neut) and macrophages (Macs) from CGD and WT animals (normalized to WT; n = 9). The data were first normalized to β-actin; then, WT levels were set to unity. (C) BMDCs were stimulated with PBS or GlyAg in vitro for 24 h and then evaluated for iNOS expression as before (normalized to WT; n = 9). (D) Western blots of BMDC lysates following stimulation were performed to compare the iNOS protein levels in WT and CGD BMDCs stimulated with GlyAg. Data shown are representative of n = 3 independent experiments. All error bars represent mean±SEM.