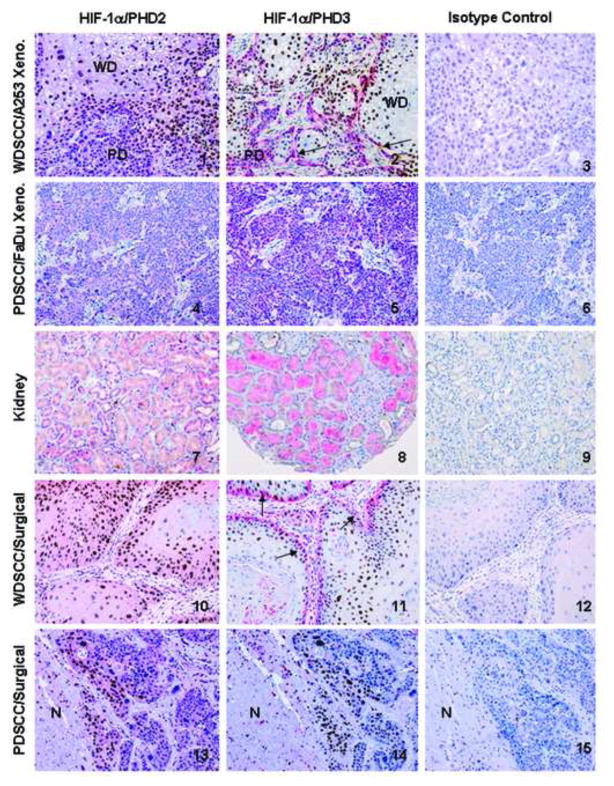
Figure 1.
Demonstration the colocalization of HIF-1α/PHD2,3 by double immunohistochemical staining method (HIF-1α: brown nuclei; PHD2,3: pink cytoplasm) in formalin/paraffin sections of human well differentiated (WD) squamous cell carcinoma (SCC) xenograft A253 (Panels 1–3); poorly differentiated (PD) SCC xenograft FaDu (Panels 4–6); kidney as normal human tissue (Panels 7–9); and representative surgical samples of oropharyngeal SCC: WD (Panels 10–12) and PD (Panels 13–15). All sections were counterstained with hematoxylin. Original magnification of each photomicrograph is the same (200X). 1: The WD part of the tumor is hypoxic (because of the lack of blood vessels) therefore, the cancer cell nuclei are positive for HIF-1α (brown) and PHD2 expression is not detectable or low in the cytoplasm. 2: Same pattern of immunostaining is seen for HIF-1α and PHD3, as in the previous panel demonstrating the inverse correlation between them. 2 and 11: arrows show one layer of PD tumor cells at the rim of WD areas, where the majority of nuclei are HIF-1α negative, with strong PHD3 positive cytoplasm (strong pink) indicating that there is a difference in PHD3 expression in HIF-1α positive and negative tumor cells. 3 and 6, 9, 12, 15: are all the corresponding isotype matched negative controls, showing no immunoreactivity in the nuclei or the cytoplasm of tumor or normal cells. These photomicrographs are representative isotype matched controls for both HIF-1α/PHD2 and HIF-1α/PHD3 since none of them showed nonspecific staining. 4: There is no immunoreaction in the nuclei, indicating the lack of HIF-1α expression, but there is expression of PHD2 in the same tumor cells visualized by pink cytoplasmic staining. 5: It demonstrates the same correlation, as panel 4, but for HIF-1α and PHD3. 7: Nuclei of the tubules are unreactive, showing no detectable HIF-1α, while the cytoplasm of the majority of the tubules is pink, indicative for PHD2 expression. 8: Same pattern of expression and distribution is seen for HIF-1α/PHD3 like in panel 7 for PHD2. 10-11: The WDSCC surgical sample shows a very similar expression profile for HIF-1α/PHD2, 3 that is seen in the corresponding histological type of xenografts tumor A253 in panels 1 and 2. 13-14: show that another human PDSCC expressed HIF-1α at the characteristic perinecrotic region of the tumor (N: necrosis). In this tumor HIF-1α positive (brown nuclei) and HIF-1α negative (blue nuclei) tumor cells do not differ either in PHD2 expression (pink) in panel 13, nor in the PHD3 expression (undetectable) in panel 14.

