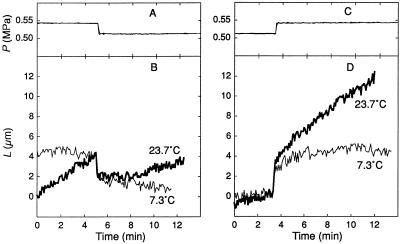
Figure 7.
Comparison of elongation at 23.7°C and 7.3°C when a C. corallina internode cell was subjected to a P step of 0.04 MPa downward (A and B) or upward (C and D). At 23.7°C (heavy trace), the cell was growing. At 7.3°C (light trace), the same cell was not growing. A and C show the superimposed P step for the two temperatures in the same cell. B and D show the rapid elongation responses to the P step superimposed in the same cell. L has been adjusted for the superposition in B and D.

