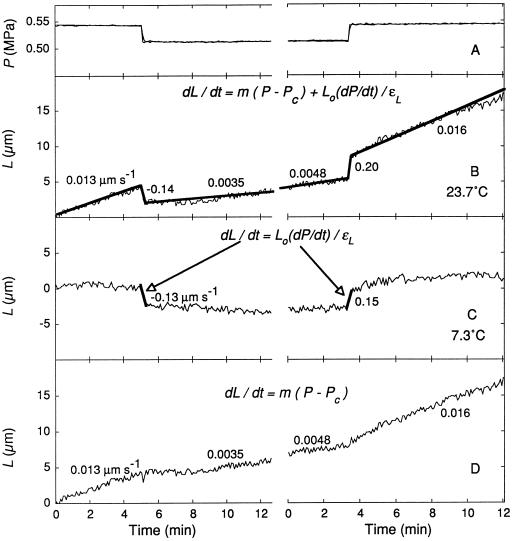
Figure 8.
Growth behavior in response to P steps for the cell in Figure 7. A, P steps down and up; B, total elongation at 23.7°C; C, total elongation at 7.3°C in the same cell; and D, growth obtained by subtracting heavy lines in C from corresponding locations in B. The relevant form of Equation 2 is shown in each graph. Data for thin lines are running averages of 20 s for measurements every 5 s, and data for heavy lines are regressions for the data in the thin lines underneath. Numbers beside heavy lines are rates obtained from slopes of the regressions. L is shown as the length beyond Lo at the beginning of the trace.

