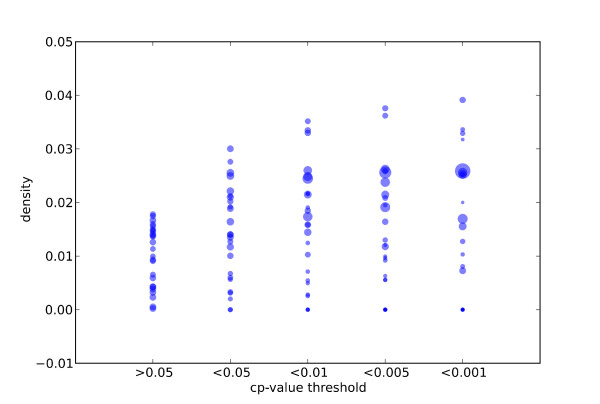
Figure 5.
Association between SSM enrichment and co-expression. Genes (circles) from the sample set were submitted to both SSM and Gemma analyses and the overlap between genes was expressed as a density value (number of Gemma genes per gene in CEXlist) according to different cp-value thresholds. Circle size is correlated with the number of genes in CEXlists.

