Figure 6.
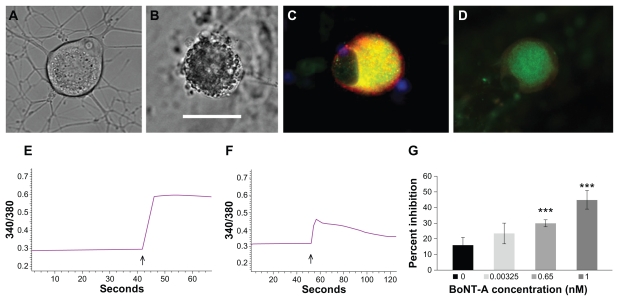
In vitro effects of botulinum neurotoxin A and E treatment in human dorsal root ganglion neurons. Differential interference contrast image of a normal untreated neuron showing few intracellular organelles and densely branched neurites (A). Similar image of a neuron treated with botulinum neurotoxin E for 48 hours, showing dense accumulation of cytoplasmic vesicles and loss of neurites (B). Immunofluorescent image of an untreated neuron with membrane-bound intense TRPV1 localization (red) surrounding cytoplasmic Gap43 (green) appearing yellow in merged areas (C). Similar image showing diminished fluorescence intensity after one hour of botulinum neurotoxin A treatment (D). Sample trace of baseline ratio of bound and unbound Ca2+ and increase in ratio after capsaicin application (arrow, E). Trace showing diminished response to capsaicin (arrow) following pretreatment with 0.65 nM botulinum neurotoxin A (F). Graph showing dose-related percent inhibition of capsaicin responses following acute botulinum neurotoxin A treatment (G). Bar = 45 μm in B, applies to A, C, and D.
Note: ***P = 0.0036 for 0.65 nM botulinum neurotoxin A and P = 0.005 for 1 nM botulinum neurotoxin A.

