Abstract
Many antiretroviral drugs have large blood plasma (BP): seminal plasma (SP) ratios based on total drug concentrations. Concern exists that these drugs don’t adequately penetrate the male genital tract (MGT), resulting in a pharmacologic sanctuary with ineffective MGT concentrations despite effective blood concentrations. Efavirenz (EFV) is the most highly protein-bound antiretroviral drug, with >99% binding in blood plasma and the largest BP:SP total EFV concentration ratio, reportedly ranging from 11 to 33. To evaluate protein binding as the explanation for blood-semen differences, we developed a novel centrifugation time corrected ultrafiltration method to measure protein binding in both matrices. In 6 subjects, protein-free EFV concentrations were the same in blood and semen; median (IQR) protein-free EFV SP: BP ratio calculated for each individual was 1.21 (0.99 – 1.35). EFV protein binding was 99.82% (99.79 – 99.86) in BP and 95.26% (93.24 – 96.67) in SP. The MGT is not a pharmacological sanctuary from efavirenz.
Introduction
The leading cause of HIV infection is sexual transmission through HIV-laden semen[1]. Combination antiretroviral (ARV) therapy has been shown to effectively reduce viral replication and viral load, resulting in prevention of disease progression. Many ARV drugs have been shown to inadequately penetrate the male genital tract (MGT) [2] [3]. Sufficiently limited drug access to the MGT may create a ‘pharmacological sanctuary’, thus permitting local viral replication, increasing the risk of sexual transmission, and potentially engendering resistance[4] [5] [6]. The heterogeneity in ARV drug distribution into the MGT is largely unexplained; however, ion-trapping is unlikely to be a cause[2] [7]. Many ARV’s have large blood plasma (BP) to seminal plasma (SP) drug concentration ratios at any sample time when total drug is measured. Protein binding has been suggested as an explanation for these large observed ratios. The ‘free drug’ hypothesis posits that only unbound (protein-free) drug in BP is free to cross into the MGT and exert its desired effect [8] [9] [10] [6]. Subsequent to crossing, protein binding in the MGT would influence the drug concentration equilibrium between the compartments. The main binding proteins of ARV drugs are albumin and alpha-1 acid glycoprotein (AGP). HIV-1 non-nucleoside reverse transcriptase inhibitors predominantly bind to albumin while protease inhibitors predominantly bind to AGP[8]. Because the concentrations of these binding proteins vary between different body compartments, protein binding can be a source of significant inter-compartmental heterogeneity in total drug concentration. Additionally, free-drug concentrations are unlikely to correspond with total drug concentration in each compartment.
Efavirenz (EFV) is a non-nucleoside reverse transcriptase inhibitor used widely in antiretroviral therapy. EFV is very highly protein bound (> 99%) in blood plasma and binds predominantly to albumin[11]. The total EFV BP: SP ratio ranges from 11 to 33 in patients on EFV-containing ARV regimens [2] [12] [13]. This difference is the largest BP:SP gradient reported among ARVs, raising the possibility that the MGT is a pharmacological sanctuary with respect to EFV. However, the concentration of albumin is reported to be much lower in the seminal plasma (0.1 g/dl) than the blood plasma (3.4–5.4 g/dl) [7]. With the observed protein differences in SP and BP, we hypothesized the protein binding to be less in SP, which would result in a smaller concentration gradient of free EFV from BP to SP.
The aim of this study was to determine the concentration of total and protein-free EFV in both BP and SP to assess whether the MGT acts as a potential pharmacological sanctuary. Samples were obtained from a previously completed clinical study in which multiple steady-state blood and seminal plasma samples were available from 6 patients receiving EFV treatment [3]. Protein-free EFV was separated from protein-bound EFV using an ultrafiltration method. The concentrations of EFV were determined using a highly sensitive LC-MS/MS assay, designed to measure both total concentration ranges as well as protein-free concentration ranges [14].
Widely used methods of separating protein-free drug from protein-bound drug include equilibrium dialysis and ultrafiltration[15]. Equilibrium dialysis is not optimal for very small sample volumes. We selected ultrafiltration to accommodate low volume SP samples obtained in this study (and anticipated in future studies in which semen is sampled relatively frequently) and to correct for evaporative losses of ultrafiltrate. This method accounts for the bias of centrifugation through the use of several short centrifugation intervals to create a time-dependent standard curve to determine a corrected free EFV concentration. Without this correction, overestimation of the fraction of unbound drug per sample is likely. This method allows a less biased estimate of the free drug concentration in an unperturbed sample.
Results
Subjects and Demographic
The study was performed using samples archived from a previous study in which HIV infected subjects on daily EFV were changed to an every 4 hour regimen to establish near true steady-state conditions due to the estimated 40–55 hour EFV half-life and frequent dosing interval[3]. [Note: No protein binding was measured in that study and all blood and semen samples from that study were re-analyzed for EFV and no data from that prior study is reported here except a description of subjects and overall study design.] During steady-state conditions, subjects provided blood and semen samples at specified time points. Within subjects, the blood and seminal plasma concentrations of EFV did not show significant deviation across sampling time points. The near equilibrium, steady-state conditions within each patient allowed the calculation of blood to semen ratios without deviations due to inter-compartmental diffusion delay.
Total and Free EFV in Blood and Seminal Plasma
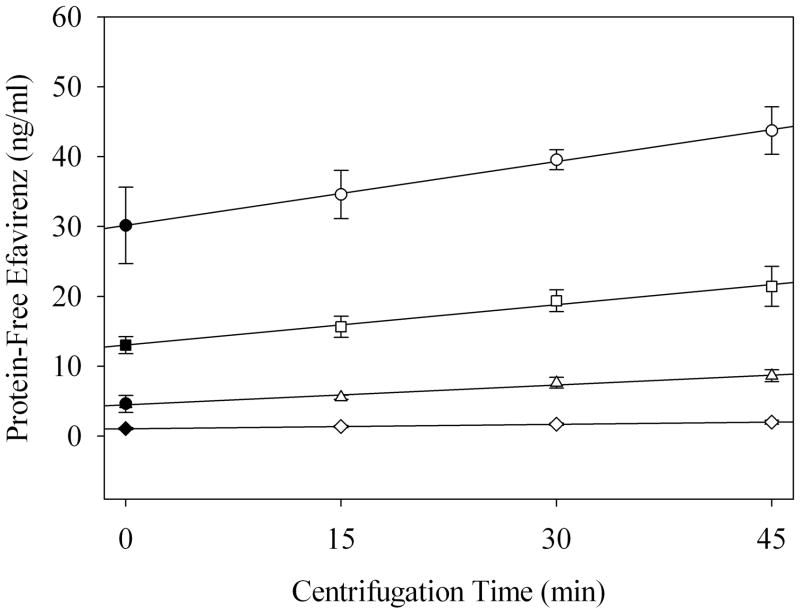
In order to correct for bias introduced by centrifugation time and small sample volumes, we employed an ultracentrifugation method, based on a previously validated method using indinavir (IDV) [16] [17]. For the following results, we generated a centrifugation time vs. free EFV concentration curve for each clinical sample. Then, we used a simple regression for each sample to correct for centrifugation time effects and estimate unbiased free EFV concentrations at time equal to zero (Figure 1).
Figure 1.
Linear regression of seminal plasma quality control centrifugation-time dependent EFV concentration curves: 1,000 ng/ml (○), 500 ng/ml (□), 200 ng/ml (△), 50 ng/ml (◇). Closed symbols represent the estimated concentration prior to any perturbations caused by centrifugation. Data are shown as the mean and a 95% confidence interval.
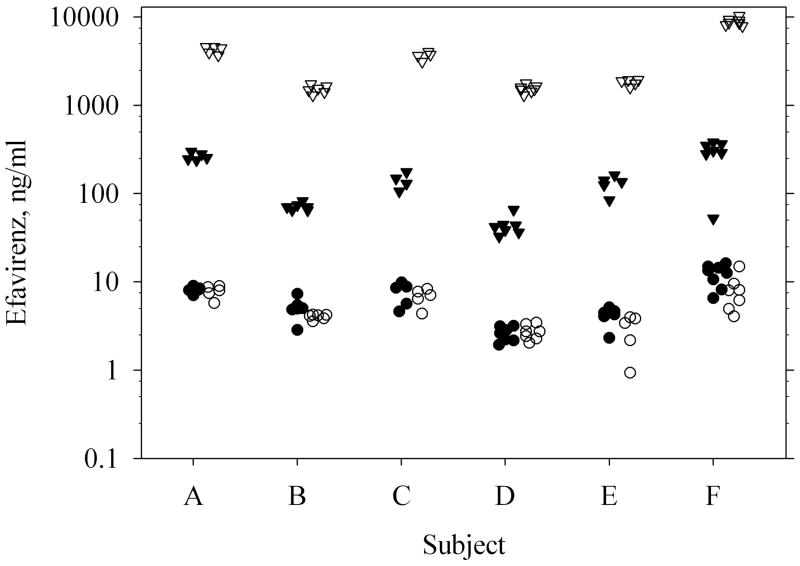
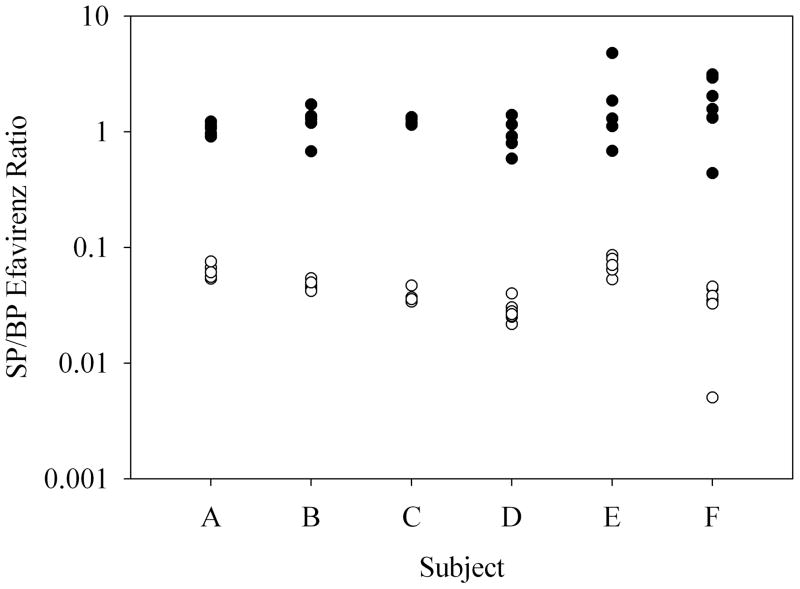
Total EFV concentration [median (interquartile range)] in BP was 1940 ng/ml (1593 – 4555 ng/ml), while total EFV concentration in SP was 136 ng/ml (66 – 255 ng/ml) (Figure 2). Using paired blood and seminal plasma samples from multiple time points from each individual, total EFV SP: BP concentration ratio was 0.044 (0.033 – 0.054), a 22.7 fold difference (18.5 – 29.9) (Figure 3). By contrast, protein-free EFV concentration in BP and SP was 4.2 ng/ml (3.4 – 7.7 ng/ml) and 5.4 ng/ml (4.1 – 8.6 ng/ml), respectively (Figure 2). Within subjects, the free EFV concentrations in SP were slightly greater than those in BP (p=0.002); the median (IQR) of the protein-free EFV SP: BP ratios calculated for each individual was 1.21 (0.99 – 1.35). Seventy-four percent of the patient samples had slightly greater free EFV concentrations in the SP than the BP. This ratio is in contrast to the total EFV concentration ratio, which showed significantly less total EFV in the SP than the BP.
Figure 2.
Total and protein-free EFV concentrations in blood and seminal plasma samples. Total EFV in BP (▽), total EFV in SP (▼), protein-free EFV in BP (○), protein-free EFV in SP (●). Each data point represents one of up to 7 samples collected at different times during the 5 day inpatient stay. Data are jittered within the x-axis dimension to avoid overlap.
Figure 3.
Protein-free EFV concentration ratio of SP/BP (●), and total EFV concentration ratio of SP/BP (○).
Protein Binding and Albumin Concentrations
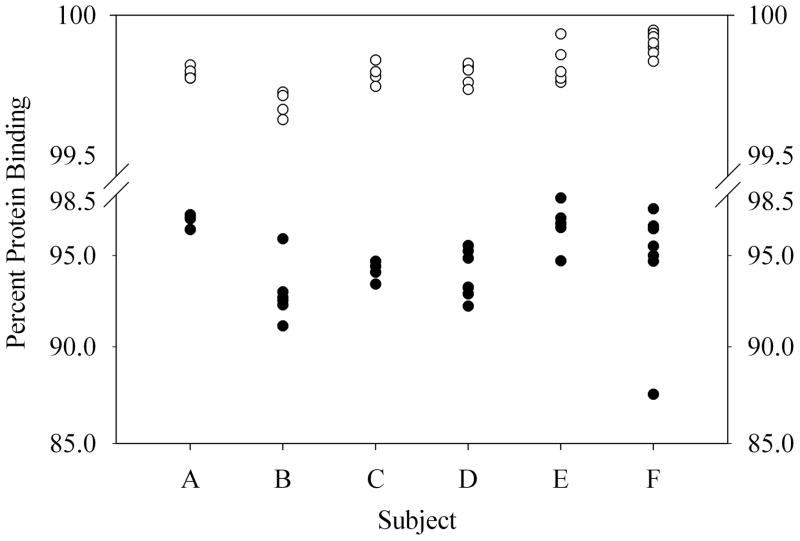
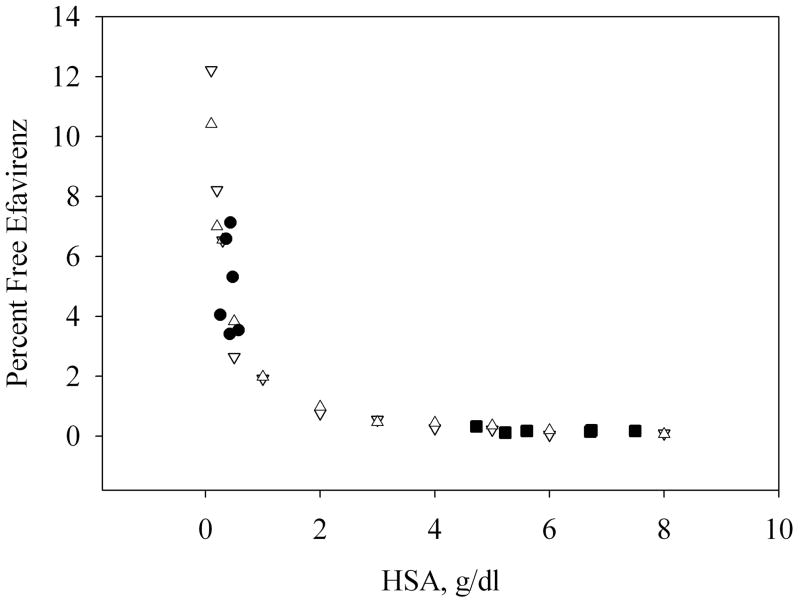
The protein binding [median (IQR)] of EFV in BP, 99.82% (99.79 – 99.86%), was significantly greater than the protein binding in SP, 95.26% (93.24 – 96.67%) (p<0.001, Figure 4). The concentration of albumin in the patient’s BP was 5.81 g/dl (5.26 – 6.41 g/dl) and in the patient’s SP it was 0.42 g/dl (0.37 – 0.49 g/dl). In vitro titration of EFV (3000 ng/ml and 300 ng/ml) and binding to human serum albumin (HSA; 0.1 – 8 g/dl) revealed a strong correlation between HSA concentration and free EFV concentration (Figure 5). This correlation can be best described using a mass-effect model with a stoichiometry of EFV binding to albumin of approximately 1 and a Kd of 2.05 (1.72–2.39) μM. Data obtained from our clinical samples are consistent with this model (Figure 5). The overall Kd of EFV binding to albumin (mean and 95% CI) in study participants was 1.68 (1.16 – 2.2) in BP and 3.27 (1.99 – 4.55) in SP; the difference is not statistically significant.
Figure 4.
Protein binding of EFV in blood plasma (○) and seminal plasma (●).
Figure 5.
The relationship between protein binding and albumin concentration. EFV BP and SP patient samples are compared with an in vitro titration of HSA and EFV. SP patient samples (●), BP patient samples (■), In vitro HSA binding assay (0.1 – 8 g/dl) at 300 ng/ml of EFV (▽) and at 3,000 ng/ml of EFV (△). Patient data shown is the result of one SP and BP pair selected from each patient at a single sampling time within the study.
Discussion
We have shown that free EFV concentrations are similar in the semen and blood, despite a very large total EFV concentration gradient between these two body compartments. This result is best explained by our finding of lower albumin concentration in semen compared to blood resulting in lower protein binding in semen. This explanation is also supported by our in vitro demonstration that EFV protein binding varies with the albumin concentration throughout the range of albumin concentrations relevant to blood and semen. The fraction of free drug increases with increasing total drug concentration and decreasing protein concentration. Pharmacodynamic effect is a function of the amount of free drug available at the site of action according to the free drug hypothesis[8] [9] [6]. With our finding of equivalent concentrations of free EFV in blood and seminal plasma, one would anticipate equivalent antiretroviral effect in both the blood and MGT.
It has been widely reported that many ARV’s do not adequately penetrate the MGT, thus raising concerns about a pharmacologic sanctuary. However, assertions that some drugs penetrate the MGT poorly are based almost exclusively on total drug concentrations and essentially all of the potent ARVs are highly protein bound. EFV is the most highly protein bound ARV with reports in the literature ranging from, 99.5 – 99.75% [2] [8] [11], very similar to our findings of 99.82%. In three prior reports, the BP:SP ratio varied little at various times throughout the 24-hour dosing interval and ranged from 11 to 33[2] [12] [13]. These studies were in HIV positive patients on EFV-containing ARV regimens under pseudo-steady-state conditions. In our HIV positive patients, under nearly true steady-state conditions (4 hourly dosing of EFV), the finding of a total EFV BP:SP ratio of 22.7 (IQR, 18.5 – 29.9) falls at the midpoint among the 3 prior reports. Given our 4-hourly dosed subjects, we would expect smaller peak-trough ratios than expected with daily dosing, however, the difference would be minor given the already minimal fluctuations of blood to semen total EFV ratios reported by others [13].
To our knowledge, there are only 2 additional reports apart from this one, of free ARV drug concentrations in seminal plasma[16] [18]. In all 3, a large BP:SP total drug concentration ratio is reduced to 1 or less than 1 when calculating the protein-free drug ratio. Using ultrafiltration with a similar centrifugation time-dependent adjustment, we previously reported that the total indinavir (IDV) concentrations do not reflect the free IDV concentrations in SP as compared to BP [16] [17]. That study also showed the BP:SP ratio changing throughout the dosing interval as the ratio was not far from 1 and the concentration-time course varied between BP and SP. This time-dependent effect was largely irrelevant for EFV due to the near steady state conditions and a much larger total EFV BP:SP ratio. Recently, Brown, et al. used an equilibrium dialysis method to report higher maraviroc concentrations in SP when compared to BP and a significantly lower protein binding in SP (5%) when compared to BP (75%) [18]. Because they pooled SP from several post-dose collection times for each individual, a paired SP: BP ratio of maraviroc concentration at specific times could not be determined. Therefore, while there may be exceptions among drugs not yet tested, none of the 3 ARVs tested demonstrate poor penetration into the male genital tract when protein binding is taken into account, despite total drug concentration gradients that indicate otherwise.
The reason for so few reports of free ARV drug concentration in the MGT may be due to methodological limitations which we have described. In order to measure free EFV concentrations in viscous, small seminal plasma volumes with very low EFV concentrations, we developed a novel time-dependent ultrafiltration method to determine free EFV concentrations for use with our highly sensitive LC-MS/MS assay. Our MGT work has focused on development of methods to estimate sub-compartmental (seminal vesicle distinct from prostate), protein-free, area-under-the-concentration-time curve with sampling in a single dosing interval. The split ejaculate sampling for sub-compartmental estimates[19], and the frequent sampling required for single dosing interval AUC estimation [3] create the need for a method that is useful with small sample volumes. While ultrafiltration is useful for small volume samples, a potential problem is an apparent increase in protein-free drug concentration estimates with increasing centrifugation time; these changes may be due, in part, to evaporative losses. To account for the bias related to centrifugation time-related changes, we employed a centrifugation time-dependent standard curve to allow estimation by simple linear curve fitting with back extrapolation to the origin of the time axis. Thus, we provide a more accurate estimate of free drug concentration and protein-binding in the initial conditions. Additionally, this method will be generally useful for studying highly protein-bound drugs in compartments that yield low volumes, such as cerebrospinal fluid or vitreous/aqueous humor [20] [5].
The Kd value in patients, 2.47 μM, was slightly higher than the in vitro HSA titration Kd value, 2.05 μM. This may reflect the fact that the HSA was diluted in PBS rather than blood and seminal plasma from patients. However, the difference does not appear to be statistically significant as the 95% confidence interval associated with the mean Kd in patients covers in vitro HSA titration Kd value. In this study, the minimum albumin concentration was 0.26 g/dL in SP and 4.73 g/dL in BP. The model-predicted percent of protein-free EFV was therefore less than 6.0% in SP and less than 0.35% in BP, regardless of total EFV concentration. At the median EFV concentration in SP (136 ng/ml), 50% of EFV would be unbound if the protein concentration was as low as 13.7 mg/dL. The stoichiometry estimated from this analysis is consistent with the report from Bocedi et al. [21]. However, the Kd value in our study is 40-fold lower. The reason for this difference is unknown, but it may be related to the difference in the study design. For example, in Bocedi’s study, all experiments were carried out with a single albumin concentration, 33.5 mg/dL, which was 20-fold lower than their estimated Kd. Moreover, using the result from their in vitro study, Bocedi et al. predicted an 84% of EFV-protein binding in blood plasma, which is much lower than the findings from ours and other in vivo studies (99.5 – 99.75%) [2] [7] [12] [13].
In summary, we have demonstrated nearly equivalent concentrations of free EFV in BP and SP despite 20-fold higher total EFV concentrations in BP when compared to SP. The difference is best explained by EFV protein-binding to albumin and lower albumin concentrations in SP when compared to BP. A novel centrifugation time-dependent ultrafiltration method enabled the separation of protein-free EFV from protein bound EFV in very small volumes of SP and BP. A highly sensitive LC/MS/MS assay provided the sensitivity to quantify the broad range of total and protein-free EFV concentrations in SP and BP. Similar free EFV concentrations in blood and semen should allay prior concerns and reject the notion that the MGT is a pharmacological sanctuary with regard to EFV.
Methods
Clinical Study
The clinical samples were obtained from a previously completed clinical study in which multiple paired samples of blood plasma and seminal plasma were available for each of 6 study participants[3]. Subjects enrolled were male, 18 years or older, had a creatinine clearance greater than 80 mL/min, and were HIV infected on a daily regimen that contained 600 mg EFV QD. On study, the EFV dosing regimen was changed to 100mg doses of EFV every 4 hours to achieve nearer to true steady-state, near equilibrium EFV concentrations in blood and semen; given the >40 hour EFV half-life, our regimen was designed to achieve peak to trough ratios less than those seen with 600 mg once daily.. Paired blood and semen samples were obtained over a course of 5 days; all but 2 of up to 7 samples were collected pre-dose. The study protocol was approved by the Western Institutional Review Board and each subject provided written informed consent prior to the study. The use of archived clinical samples for this current study was approved by the Johns Hopkins Medicine Institutional Review Board.
Separation of Protein-Free from Protein-Bound Efavirenz by Ultrafiltration
Ultrafiltration of samples was performed using 96 well plates with a 10kDa filter membrane (Millipore, Billerica, MA, USA). Nonspecific binding for EFV to the apparatus was not significant for the blood and seminal plasma matrices. Blank blood plasma for quality control preparation and method development was obtained from Biological Specialty Corporation (Colmar, PA, USA). Blank seminal plasma was obtained from Bioreclamation, Inc. (Westbury, NY, USA). To each well of the ultrafiltration plate, 100 μl of sample was added. Samples and quality controls were incubated for one hour at 37°C. The plates were centrifuged at 15 minute intervals for 45 minutes at 37 °C. At every 15 minute interval, 10 μL of the filtrate was collected in a v-bottom 96 well collection plate. Filtrate samples were then analyzed for EFV concentration. Samples of known concentration (quality controls) were run simultaneously with each set of clinical samples to ensure assay stability. Quality controls were prepared in blood and seminal plasma to span the ranges observed in steady state patient samples. The free EFV concentration in the clinical samples evaluated at the three centrifugation time points were then used to generate an EFV concentration vs. centrifugation time curve for each clinical sample. The centrifugation time-adjusted free EFV concentration was determined by using a linear regression to estimate the concentration when time equals zero minutes (unperturbed pre-centrifugation sample, figure 1). Each point estimate represents the mean (95% confidence interval). A minimum of 3 replicate time-dependent curves prepared from different matrix lots were used to assess variability. The protein binding of EFV in blood and seminal plasma matrices was shown to be stable for at least 5 freeze/thaw cycles. Percent protein binding was calculated as the centrifugation time-adjusted free drug concentration divided by the total drug concentration multiplied by 100. Differences in the EFV concentrations between body compartments were tested using the Wilcoxon rank sum test.
Quantification of Efavirenz by UPLC-MS/MS
Total and protein-free EFV concentrations were determined using UPLC tandem mass spectrometry. Existing assays did not have the necessary sensitivity to detect the low free EFV concentrations we anticipated finding in seminal plasma, so we developed a highly sensitive method [14] using a UPLC-MS/MS system from Applied Biosystems/MDS-Sciex API5000 (Foster City, CA) interfaced with an Acquity UPLC consisting of a Sample Manager and Binary Solvent Manager (Waters Corp., Milford, MA, USA). The assay was designed to measure the clinically relevant ranges in both blood and seminal plasma as well as the potential ranges of protein-free efavirenz. We used two standard curves; the high standard curve was linear from 100 ng/mL to 10,000 ng/mL and the low standard curve was linear from 0.5 ng/mL to 500 ng/mL (range). The method employs a racemic fluorinated analog of EFV (F-EFV) as the internal standard. EFV and F-EFV were eluted from a reverse-phase UPLC column (2.1 × 50 mm Acquity UPLC BEH C18) via gradient elution with detection via negative ion multiple reaction monitoring (MRM). The assay possesses accuracy (%dev) of −8.9% to 6.4% and precision (%CV) of <8%. The analytical technique is capable of a reliable detection limit of 15 femtomoles of EFV injected on column. Results from the UPLC-MS/MS assay were very similar to those obtained from the previous HPLC-UV method developed in the original study [3]. Analysis of archived samples in both assays demonstrated analyte stability during long-term storage (−80°C), and an assay comparison showed deviations of total concentrations to be ≤20%.
Quantification of Albumin
Albumin quantification was performed using a QuantiChrom BCG Albumin assay Kit, DIAG-250 (BioAssay Systems, Hayward, CA, USA). 10μl samples of each blood plasma, seminal plasma, and/or standard sample were analyzed according to the manufacturer’s instructions. Blood plasma samples were diluted 2-fold with water before analysis. The difference in percent protein binding of EFV in SP and BP was tested using the Wilcoxon rank sum test.
In Vitro HSA Titration
An in vitro assay was designed to determine the binding of EFV at different concentrations of human serum albumin (HSA). HSA in vitro standard solutions in PBS were prepared at 0.1, 0.2, 0.3, 0.5, 1.0, 2.0, 3.0, 4.0, 5.0, 6.0, and 8.0 g/dl. The HSA concentrations are above and below the physiological concentrations seen in BP and SP. EFV was added at 300 ng/ml and 3,000 ng/ml to each of the HSA solutions (representative of EFV concentrations seen in SP and BP, respectively). Samples prepared at concentrations of less than 0.1 g/dl HSA showed evidence of non-specific binding of EFV to the ultrafiltration apparatus; therefore, 0.1 g/dl HSA was defined as the lower limit of the titration curve. The samples were subjected to ultrafiltration for protein separation and UPLC-MS/MS for EFV quantitation.
Estimation of EFV-Albumin Dissociation Rate Constant (Kd) and the Stoichiometry of EFV Binding to Albumin
Based on the law of mass action, the Kd can be estimated with the following equation:
where P is the total protein concentration, CT is the total EFV concentration, and n is stoichiometry of EFV binding to albumin. Numerical searching with data from in vitro HSA titration study was performed to estimate Kd and n through minimizing the deviation of model-predicted CT and actual CT. The estimated n was then used to calculate Kd for each trial participant.
Acknowledgments
This work was supported by the following grants from the National Institutes of Health: HIV Prevention Trials Network (HPTN) sponsored by the National Institute of Allergy and Infectious Diseases (NIAID), National Institute on Drug Abuse (NIDA), National Institute of Mental Health (NIMH), and Office of AIDS Research, of the NIH, DHHS (U01-AI-068613); a Midcareer Investigator Award for Patient-Oriented Research (NIH K24 AI 01825); National Center for Research Resources (UL1 RR 025005), a component of the National Institutes of Health (NIH), and NIH Roadmap for Medical Research. Its contents are solely the responsibility of the authors and do not necessarily represent the official view of NIH. The authors are grateful to study participants as well as the staff of the Drug Development Unit who carried out the original clinical study from which the samples were taken.
References
- 1.Royce RA, Sena A, Cates W, Cohen Sexual Transmission of HIV. N Engl J Med. 1997;336:1072–8. doi: 10.1056/NEJM199704103361507. [DOI] [PubMed] [Google Scholar]
- 2.Kashuba AD, Dyer JR, Kramer LM, Raasch RH, Eron JJ, Cohen MS. Antiretroviral-Drug Concentrations in Semen: Implications for Sexual Transmission of Human Immunodeficiency Virus Type 1. J Antimicrob Chemother. 1999;43:1817–26. doi: 10.1128/aac.43.8.1817. [DOI] [PMC free article] [PubMed] [Google Scholar]
- 3.Cao YJ, Ndovi TT, Parsons TL, Guidos AM, Caffo B, Hendrix CW. Effect of semen sampling frequency on seminal antiretroviral drug concentration. Clin Pharmacol Ther. 2008;83:848–56. doi: 10.1038/sj.clpt.6100356. [DOI] [PubMed] [Google Scholar]
- 4.Coombs RW, Speck CE, Hughes JP, Lee W, Sampoleo R, Ross SO, et al. Association between Culturable Human Immunodeficiency Virus Type 1 (HIV-1) in Semen and HIV-1 RNA Levels in Semen and Blood: Evidence for Compartmentalization of HIV-1 between Semen and Blood. J Infect Dis. 1998;177:320–30. doi: 10.1086/514213. [DOI] [PubMed] [Google Scholar]
- 5.Reddy YS, Kashuba A, Gerber J, Miller V. Importance of Antiretroviral Drug Concentrations in Sanctuary Sites and Viral Reservoirs. AIDS Res Hum Retroviruses. 2003;19(3) doi: 10.1089/088922203763315669. [DOI] [PubMed] [Google Scholar]
- 6.Trainor GL. The Importance of Plasma Protein Binding in Drug Discovery. Expert Opin Drug Discov. 2007;2(1) doi: 10.1517/17460441.2.1.51. [DOI] [PubMed] [Google Scholar]
- 7.Cao YJ, Hendrix CW. Male Genital tract Pharmacology: Developments in Quantitative Methods to Better Understand a Complex Peripheral Compartment. Clin Pharmacol Ther. 2008;83:401–12. doi: 10.1038/sj.clpt.6100342. [DOI] [PubMed] [Google Scholar]
- 8.Boffito M, Back DJ, Blaschke TF, Rowland M, Bertz RJ, Gerber JG, Miller V. Protein Binding in Antiretroviral Therapy. AIDS Res Hum Retroviruses. 2003;19:825–35. doi: 10.1089/088922203769232629. [DOI] [PubMed] [Google Scholar]
- 9.Martin BK. Potential Effect of the Plasma Proteins on Drug Distribution. Nature. 1965;207:274–6. doi: 10.1038/207274a0. [DOI] [PubMed] [Google Scholar]
- 10.Taylor S, Pereira AS. Antiretroviral drug concentrations in semen of HIV-1 infected men. Sex Transm Inf. 2001;77:4–11. doi: 10.1136/sti.77.1.4. [DOI] [PMC free article] [PubMed] [Google Scholar]
- 11.Company BMS. SUSTIVA package insert. 2008. [Google Scholar]
- 12.Taylor S, Reynolds H, Sabin CA, Drake SM, White DJ, Back DJ, Pillay D. Penetration of efavirenz into the male genital tract: drug concentrations and antiviral activity in semen and blood of HIV-1 infected men. AIDS. 2001;15:2051. doi: 10.1097/00002030-200110190-00022. [DOI] [PubMed] [Google Scholar]
- 13.Reddy YS, Gotzkowsky SK, Eron JJ, Kim JY, Fiske WD, Fiscus SA, et al. Pharmacokinetic and Pharmacodynamic Investigation of Efavirenz in the Semen and Blood of Human Immunodeficiency Virus Type 1-Infected Men. J Infect Dis. 2002;186:1339–43. doi: 10.1086/344311. [DOI] [PubMed] [Google Scholar]
- 14.Avery LB, Parsons TL, Meyers DJ, Hubbard WC. A Highly Sensitive Ultra Performance Liquid Chromatography-Tandem Mass Spectrometric (UPLC-MS/MS) Technique for Quantitation of Free and Bound Efavirenz (EFV) in Human Seminal and Blood Plasma. J Chrom B. 2010;878:3217–24. doi: 10.1016/j.jchromb.2010.09.011. [DOI] [PMC free article] [PubMed] [Google Scholar]
- 15.Sebille B, Zini R, Madjar C, Thuaud N, Tillement J. Separation procedures used to reveal and follow drug-protein binding. J Chrom B. 1990;531:51–77. doi: 10.1016/s0378-4347(00)82280-x. [DOI] [PubMed] [Google Scholar]
- 16.Cao YJ, Parsons TL, Bakshi RP, Fuchs E, Guidos A, Martinez E, Kashuba ADM, Hendrix CW. A novel method demonstrating protein unbound indinavir (IDV) concentration in seminal plasma. American Society for Clinical Pharmacology and Therapeutics Annual Meeting; Anaheim, CA. 2007. [Google Scholar]
- 17.Cao YJ. ANTIRETROVIRAL DRUG DISTRIBUTION INTO THE MALE GENITAL TRACT. Baltimore, MD: Johns Hopkins University; 2007. [Google Scholar]
- 18.Brown KC, Patterson KB, Malone SA, Shaheen NJ, Prince HM, Dumond JB, Spacek M, Heidt PE, Cohen MS, Kashuba ADM. Antiretrovirals for prevention: maraviroc exposure in the semen and rectal tissue of healthy male volunteers after single and multiple dosing. 17th Conference on Retroviruses and Opportunistic Infections; San Francisco, CA. 2010. [Google Scholar]
- 19.Ndovi TT, Parsons T, Choi L, Caffo B, Rohde C, Hendrix CW. A new method to estimate quantitatively seminal vesicle and prostate gland contributions to ejaculate. Br J Clin Pharmacol. 2007;63:404–20. doi: 10.1111/j.1365-2125.2006.02791.x. [DOI] [PMC free article] [PubMed] [Google Scholar]
- 20.Wynn HE, Brundage RC, Fletcher CV. Clinical Implications of CNS Penetration of Antiretroviral Drugs. CNS Drugs. 2002;16(9) doi: 10.2165/00023210-200216090-00002. [DOI] [PubMed] [Google Scholar]
- 21.Bocedi A, Notaril S, Narciso P, Bolli A, Fasano M, Ascenzi P. Binding of anti-HIV drugs to human serum albumin. IUBMB Life. 2004;56:609–14. doi: 10.1080/15216540400016286. [DOI] [PubMed] [Google Scholar]


