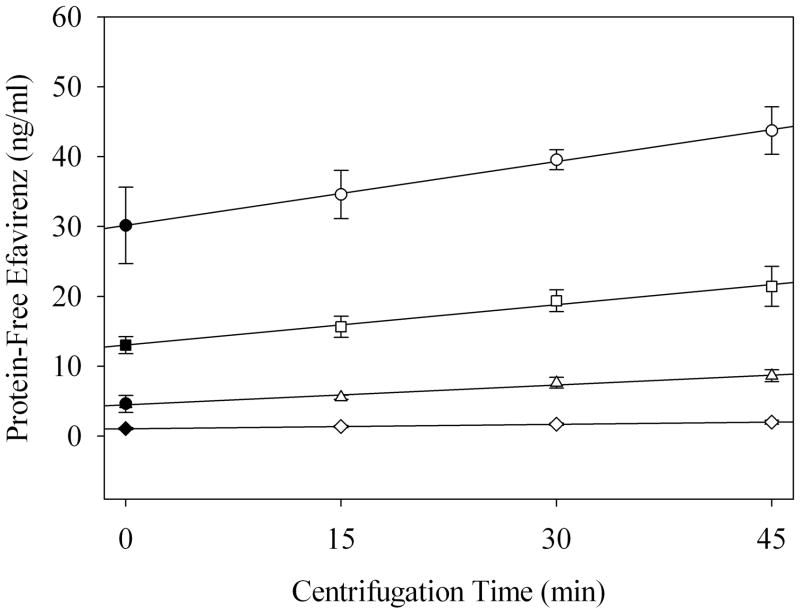
Figure 1.
Linear regression of seminal plasma quality control centrifugation-time dependent EFV concentration curves: 1,000 ng/ml (○), 500 ng/ml (□), 200 ng/ml (△), 50 ng/ml (◇). Closed symbols represent the estimated concentration prior to any perturbations caused by centrifugation. Data are shown as the mean and a 95% confidence interval.

