Figure 1.
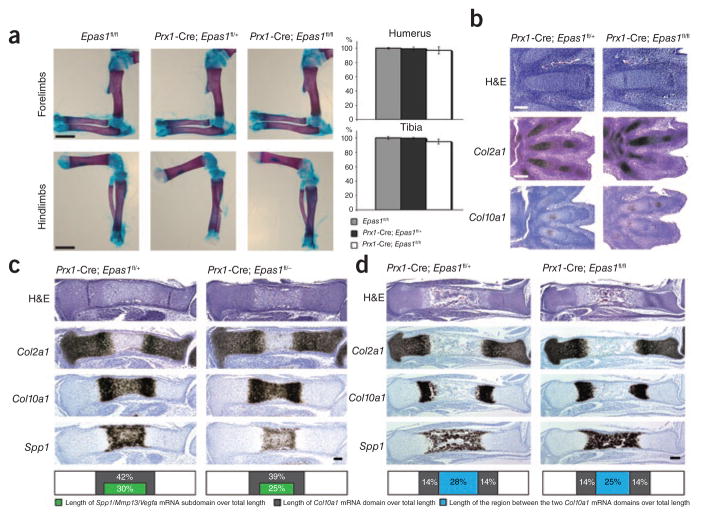
Phenotypical analysis of Prx1-Cre; Epas1fl/fl and control littermates in embryonic and neonatal stages. (a) Whole-mount alizarin red S and alcian blue staining of hindlimb and forelimb zeugopods and stylopods isolated from newborn mutant and control mice. Scale bar, 1 mm. Length of tibia and humerus is shown as percentage of Epas1fl/fl controls ± s.d. The bar graph is a quantification of the data in the images. Differences between mutants and controls are not statistically significant. (b) H&E staining and in situ hybridization analysis of E13.5 mutant and control autopods. Bright-field images are shown. Scale bars: 100 μm (top) and 200 μm (bottom two rows). (c) H&E staining and in situ hybridization analysis of E15.5 mutant and control tibias. Bright-field images of one representative experiment are shown. Scale bar, 100 μm. Lengths of Col10a1 mRNA subdomains and of Col10a1/Spp1/Mmp13/Vegfa mRNAs subdomains are expressed as percentage of specimen total length (bottom). The difference in length between the mutant subdomain expressing Col10a1, Spp1, Mmp13 and Vegfa mRNAs and control (bottom) is statistically significant (P < 0.05). (d) H&E staining and in situ hybridization analysis of E17.5 mutant and control tibias. Bright-field images of one representative experiment are shown. Scale bar, 200 μm. Lengths of Col10a1 mRNA subdomains and distance between the two Col10a1 mRNA domains are expressed as percentage of specimen total length (bottom); differences in length between mutants and controls are not statistically significant.

