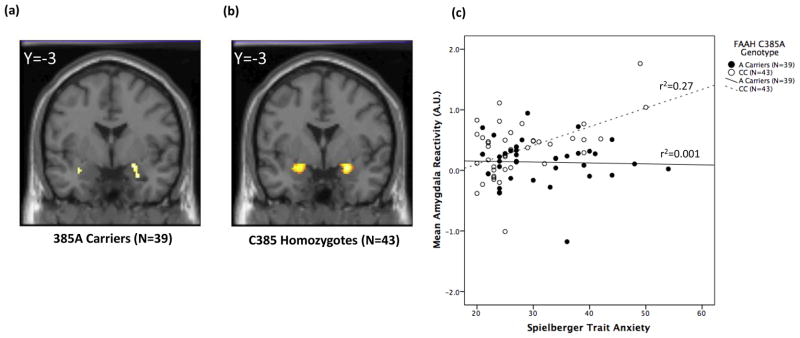
Figure 3.
Statistical parametric maps illustrating the correlation between fear-related amygdala reactivity and trait anxiety in (a) FAAH 385A carriers (right amygdala: 24, −3, −12; Z = 2.26, P =0.049, 46 voxels; left amygdala: −32, −3, −15; Z = 2.04, P = 0.046, 10 voxels) and (b) C385 homozygotes (right amygdala: 26, 1, −14; Z = 3.84, P = 0.004, 81 voxels; left amygdala: −20, −4, −10; Z = 3.82, P = 0.008, 184 voxels). (c) Plots of the differential correlation between fear-related amygdala reactivity (−22, 1, −15; Z = 3.48, P = 0.003, 13 voxels) and trait anxiety as a function of FAAH C385A genotype (β = 0.38, P = 0.03; 385A carriers: r = −0.03, P = 0.84; C385 homozygotes: r = 0.52, P < 0.001).

