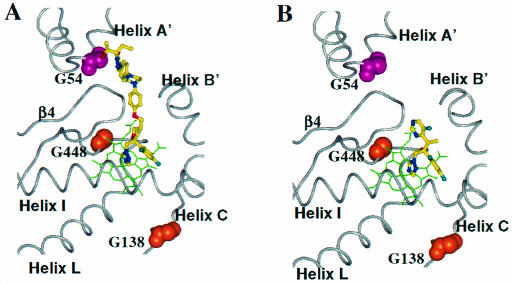
FIG. 5.
Mapping of substitutions in AF-CYP51A that cause azole resistance. The heme cofactor is highlighted in green. POS (A) and VOR (B) are shown as ball-and-stick models with their carbon atoms in yellow. The atoms of the residues at the sites of substitutions are depicted using space filling models.

