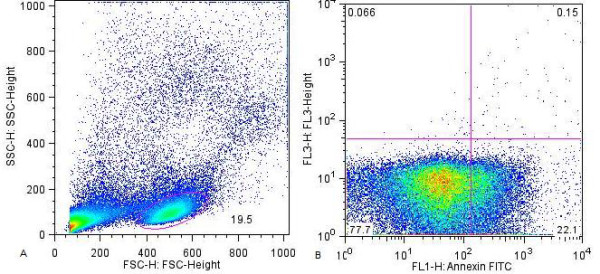
Figure 1.

Flow cytometry scatter plots for the Annexin-V assay. A: PBL were identified and gated based on forward and side scatter properties. B: Scatter plots for green and red fluorescence channels were used to measure Annexin-V and PI positivity respectively.
