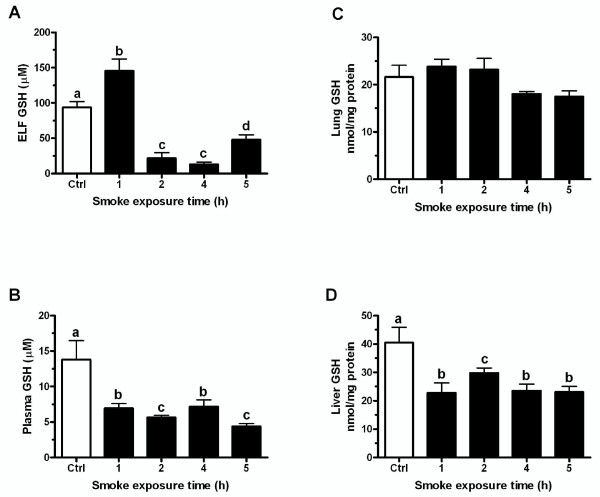
Figure 3.
Changes in GSH levels that occur during the CS exposure. Mice were exposed to CS for 1, 4 or 5 hours and sacrificed immediately following exposure. ELF (A), plasma (C), and liver (D) GSH levels fell during the CS exposure while lung (B) GSH levels were maintained throughout the exposure. Data represented as mean ± SEM, with different letters representing statistically significant differences between groups, p < 0.05.

