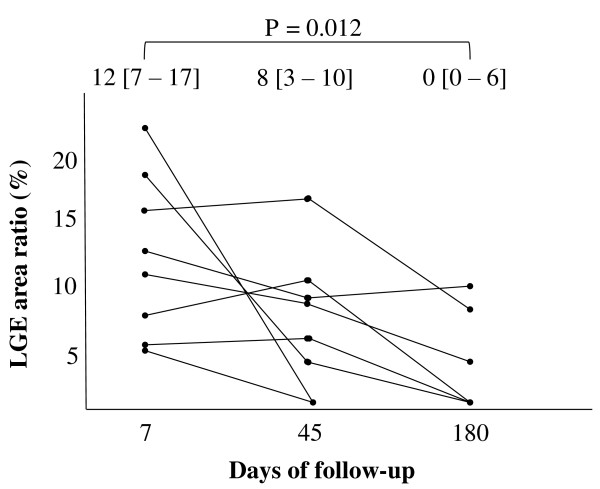
Figure 6.
Serial changes in the LGE area ratio in the 8 patients with LGE. During follow-up, the LGE area ratio decreased gradually in all patients and disappeared in 5 patients at 45-180 days. Numbers at the top of the graph indicate median and interquartile range of the LGE area ratio. LGE indicates late gadolinium enhancement.

