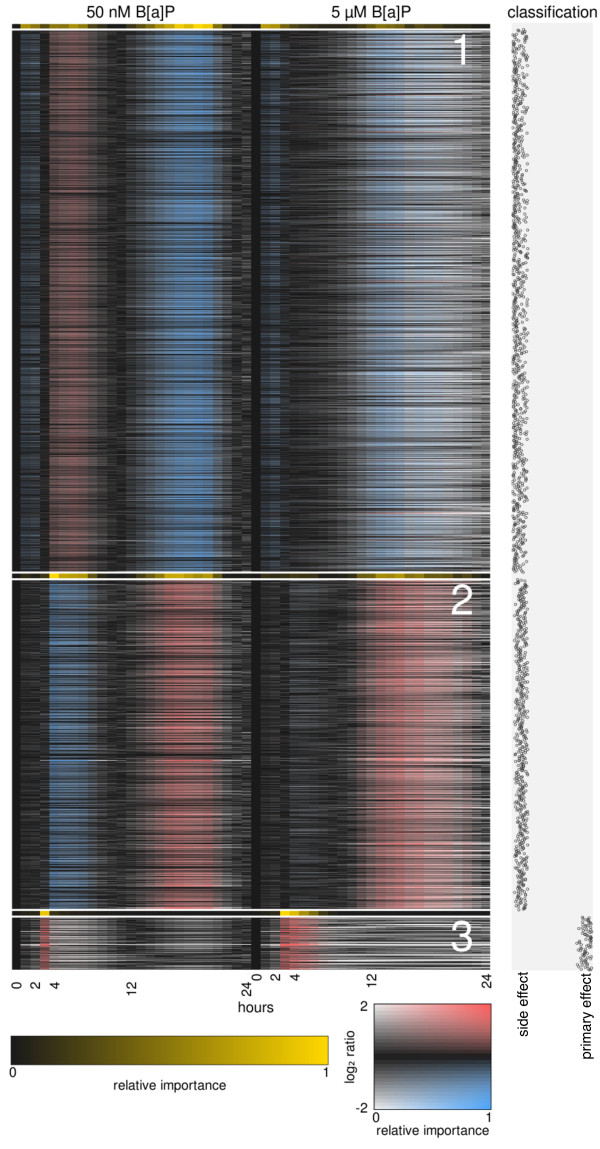
Figure 3.
Clustering with the RF proximity measure. PAM clustering was performed with a supervised, weighted distance measure, derived during the classification of Ahr primary responders and side effects. Three distinct programs were found, depicted here as clusters (1-3). Color saturation indicates the importance of the time points for the identity of the cluster. To further emphasize these important time points, this same information is shown again for each cluster (black to yellow scale). The classification of each gene is shown as the proportion of RF votes.

