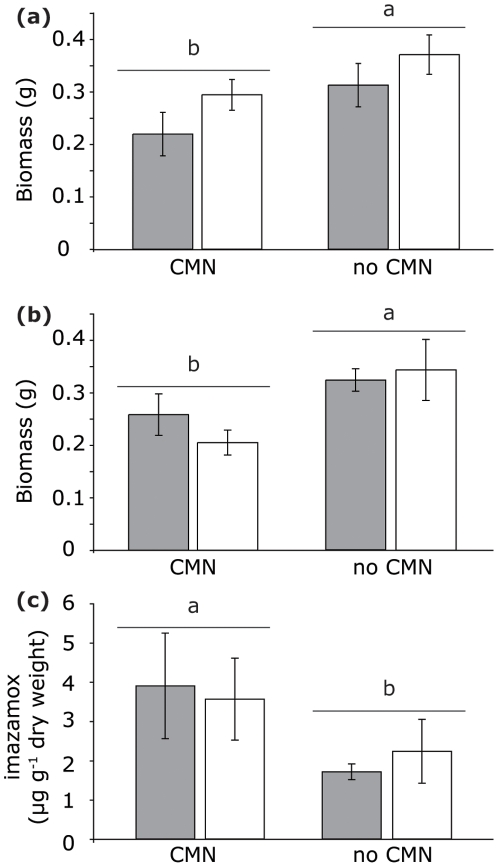
Figure 3. Results from Experiment 1 ± (means SE).
Gray bars indicate bulk soil flow, and open bars indicate no bulk soil flow. Bars with different letters indicate significant differences at α = 0.05 with a one-factor (CMN) model. (a) Above ground biomass at harvest 2 (N = 5). (b) Above ground biomass at harvest 3 (N = 5). (c) Imazamox concentrations in leaves at harvest 3 (N = 4–5).

