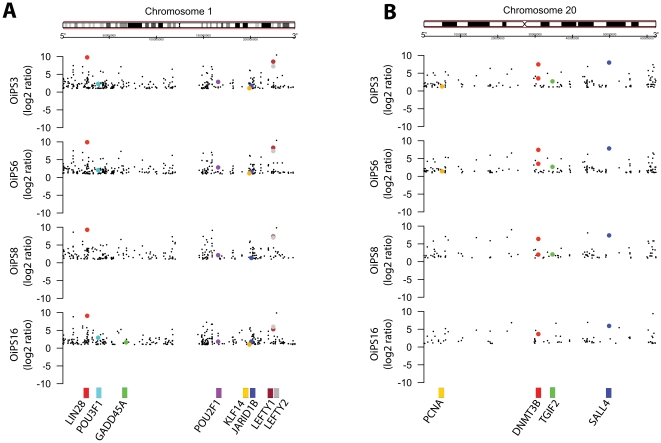
Figure 3. Enrichment of pluripotency and tumorigenicity-associated genes within chromosomes 1 and 20 in aged-iPSCs.
(A) Moving average plot analysis of chromosome 1. Expression values in NFH2-iPSC lines were compared to the parental NFH2 fibroblasts and considered over-expressed or under-expressed when fold-change>2. Each dot represents a probeset encompassing an individual gene. Highlighted in different colors are probeset for genes whose function has been associated with pluripotency, reprogramming, proliferation, or tumorigenicity. (B) Moving average plot analysis of chromosome 20. Moving average plots were produced using R/Bioconductor package GenomeGraphs.

