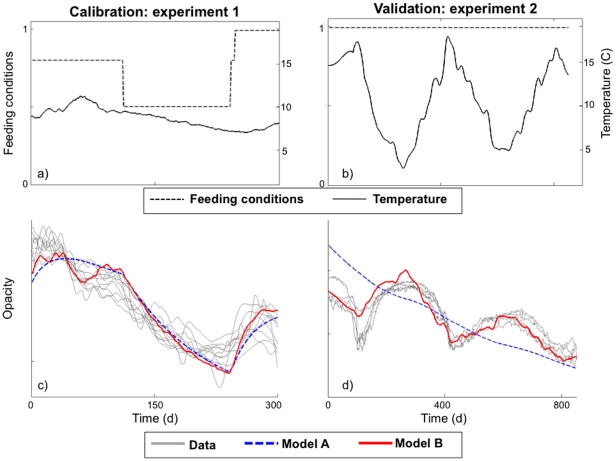
Figure 2. Model calibration and validation on cod otoliths using two experimental datasets: 1) reduced feeding conditions (day 110 to day 220) with seasonal temperature variations (left column), and 2) constant feeding with seasonal temperature cycles over a two-and-a-half-year period (right column).
We report temperature and feeding conditions (a, b) and the comparison between model simulations and opacity data (c, d). We display opacity data (Data, gray) and model simulations without the temperature effect on calcium carbonate precipitation (Model A, blue) and with this temperature effect (Model B, red).

