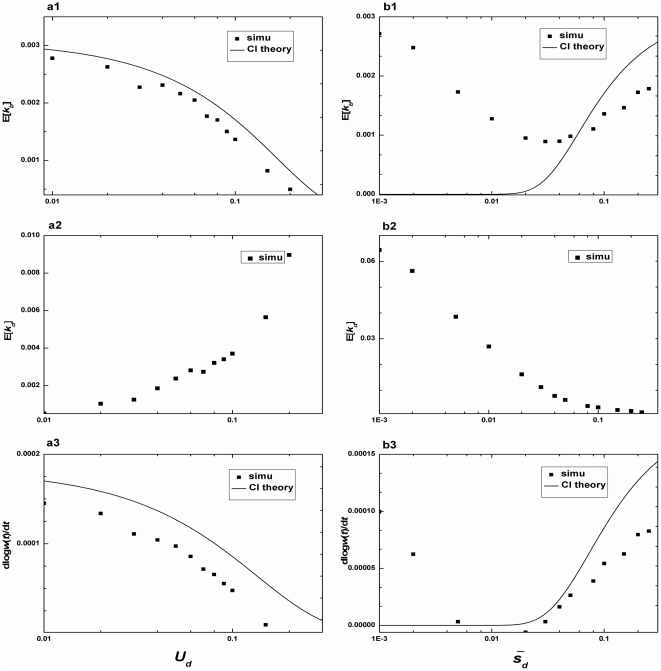
Figure 5. The substitution rate versus deleterious mutations.
a, E[kb], E[kd], dlogw(t)/dt versus Ud for N = 104, Ub = 2.0×10⁻⁵, β1 = 50, β2 = 10. b, E[kb], E[kd], dlogw(t)/dt versus  for N = 104, Ub = 2.0×10⁻⁵, β1 = 50, Ud = 1.0×10⁻¹. Solid lines are theoretical predictions from Equation (9) (E[kb]) and Equation (11) (dlogw(t)/dt), and points are simulation results.

